Readers,
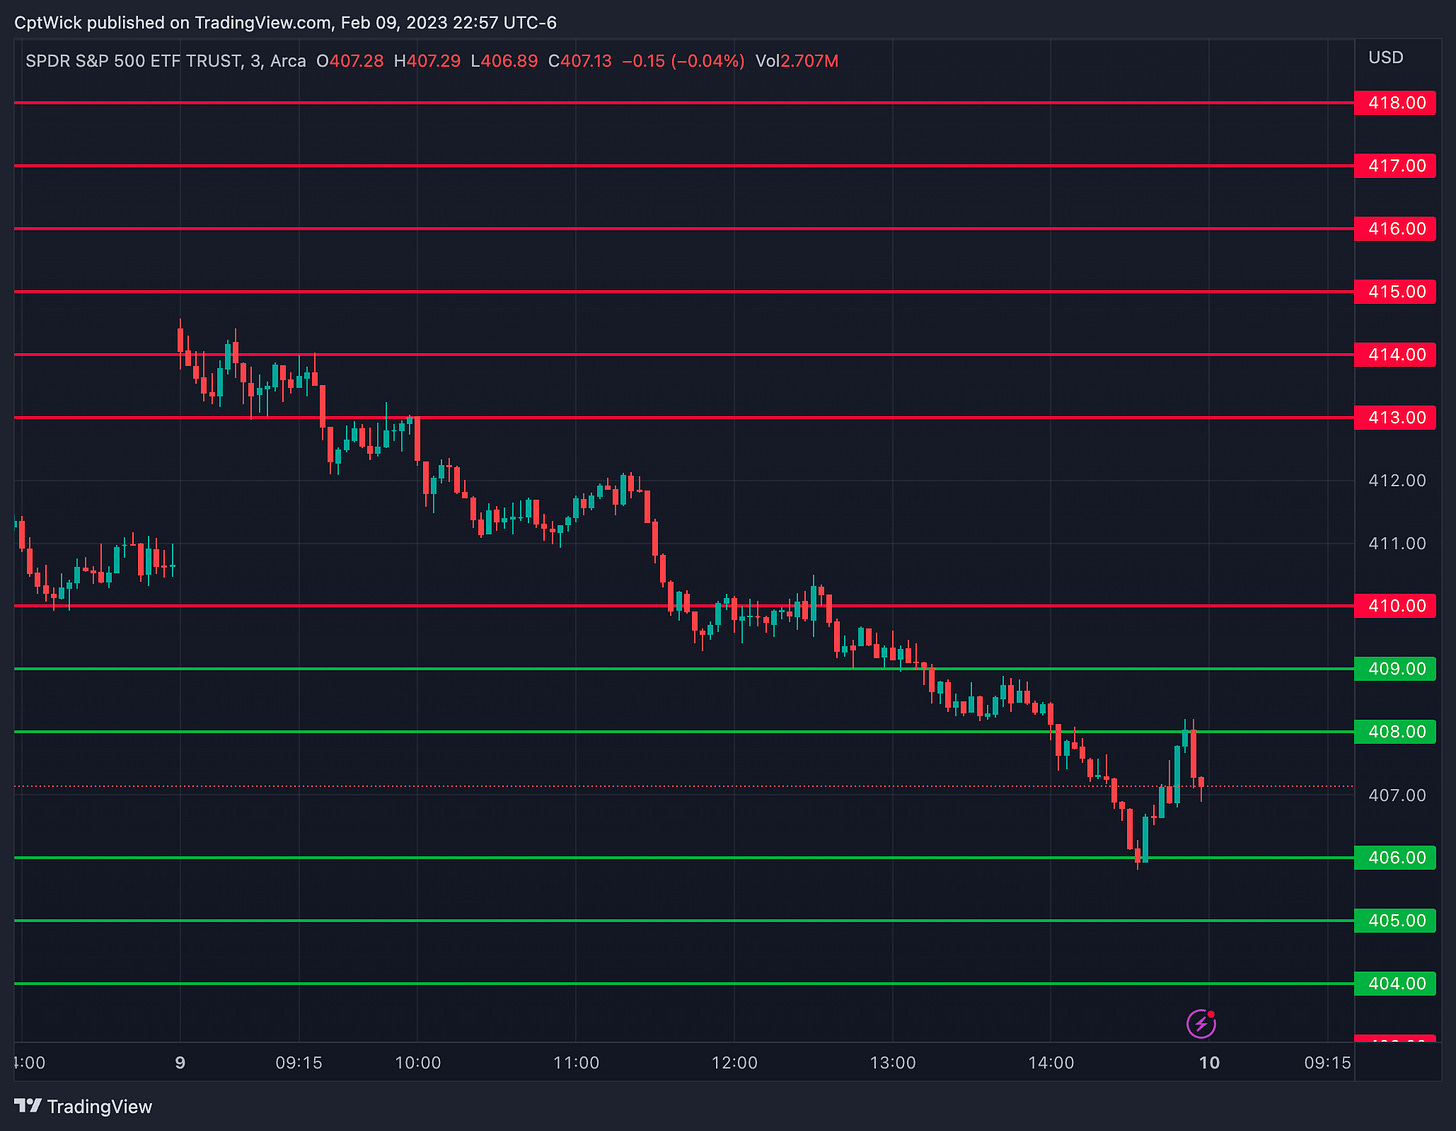
—2/9 Trade Recap—
Once again, the market adhered to the trade plan outlined in our previous update. To fully comprehend the intricacies of this successful outcome, I encourage you to review the plan at your earliest convenience. I presented multiple strategies for capitalizing on the market's movements, and it was one of the clearest and straightforward plans I have had the pleasure of sharing. As I predicted, the market attempted a false start in one direction, only to later reverse towards the other. Our precise identification of key levels proved to be spot-on, resulting in a highly profitable trading day for those who followed the plan. For your convenience, I have included a link to the plan below.
YESTERDAYS PLAN
—2/10 Pre Plan—
Start by understanding the basics of volume profile. If you're unfamiliar with this concept, there are numerous free resources available online that provide a comprehensive explanation. Here, I'd like to share with you some tips on how I approach volume profile analysis.
I'm analyzing the 8-hour chart on SPY, and I calculate its weekly volume profile. The point of control (POC) for this week is located at approximately 410.50. You can see that the price tried to breach the value area high (VAH) but failed and returned to the value area low (VAL), closing below it.
There is a naked POC (a level that hasn't been revisited since the start of a new weekly profile) at 404.20, which is an important level to keep in mind. I would expect the price to soon seek this level and potentially bounce off it, or if it continues to decline, target the VAL at 400.25.
Examining the 1D chart with the monthly volume profile reveals that last month's naked POC lies around 388.50. While I am not predicting a move to this level, it is worth noting that if the price fails to rise, it may seek value near this POC.
For science, do you guys like these volume profile break downs?
With that, let's shift our focus to the heart of the matter: Volland dealer hedging requirements. This is where we can get an idea of what can happen during RTH.
Regarding the aggregate vanna on SPY, there has been no change at the current levels. I have included a visual representation of the data for context. As you can see, there is a significant concentration of positive vanna between 415 and 396. At the close of 2/9, the current price was 407.09.
Examining the 1-day to expiration (1DTE) vanna chart on SPY, we see that the negative vanna remains above the current price and the positive vanna remains at or below the current price down to 396. For those unfamiliar, negative vanna acts as a barrier to price movement, while positive vanna attracts price. In between the vanna gap from 409-412, what’s going on there? To gain further insight, let's take a closer look at gamma.
The 1dte gamma chart is showing positive values here in this gap, meaning, this could be a area of resistance.
—2/10 Trade Plan—
With all of these indicators in mind, it's possible that we may see a revisit to the 410 level. This largely depends on the strength of selling pressure and the opening price. Our recent openings have been in proximity to negative vanna levels, which suggests that we could open around 409-410. However, if we are able to push past 410 and maintain these gains while the VIX is decreasing, there's a possibility that we could see a move to 413 and possibly even 415. Conversely, if we are trading under 410 and can’t take it back we may see a retreat to 406 and potentially even further down to 400 or 395.
Key level is 410 as long as we remain under I want to target 405, 402, 400 and above 410 target 413-415
Last nights post I mentioned a few key levels that I think the bulls needed to hold in order to keep this bullish trend. I want to keep these here for reference, the only one that is above my key level is TSLA at 200, lets see what they do tomorrow.
One last thing before we sign off for the night is this VIX chart. We monitor this chart tick of tick with SPY, I usually run this one on the 1min chart, you will notice that when you start practicing this, it helps you stay in the trade. Watch to see if they continue this up or if we want to come back and repeat the breakout, or do we fall back inside? This will help us determine if we want to target above 410 or below.
Happy Trading,
—WICK—
To cover our basis…
Welcome to my Substack where I provide a daily SPY trading plan to help guide my intraday trading. The purpose of this letter is not to advice you on your trading or investment decisions. I am simply documenting my daily trading plan for myself to help with planning and execution. These are simply my opinions and the data sourced from the likes of vol.land, TradingView, Tradytics and others. The stock market is risky, gains are not guaranteed. This is not about getting rich quick, but learn to educate yourself and make the necessary financial decisions on your own. This is not financial advice.


