SPY
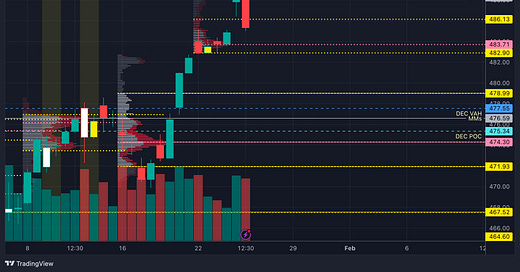
Let’s talk about SPY first. Here is what the current weekly volume profile looks like.
The current POC sits at 483.71 and the VAH and VAL are 486.13 and 482.90. We are currently back under the VAH but above the POC. That POC area is going to be on watch because it also lines up with some other key levels that I will cover later in the post.
We sold off right around the MMs weekly expected high, this level also coincided with the .786 extension from our weekly plan, if you missed it, here is a link!
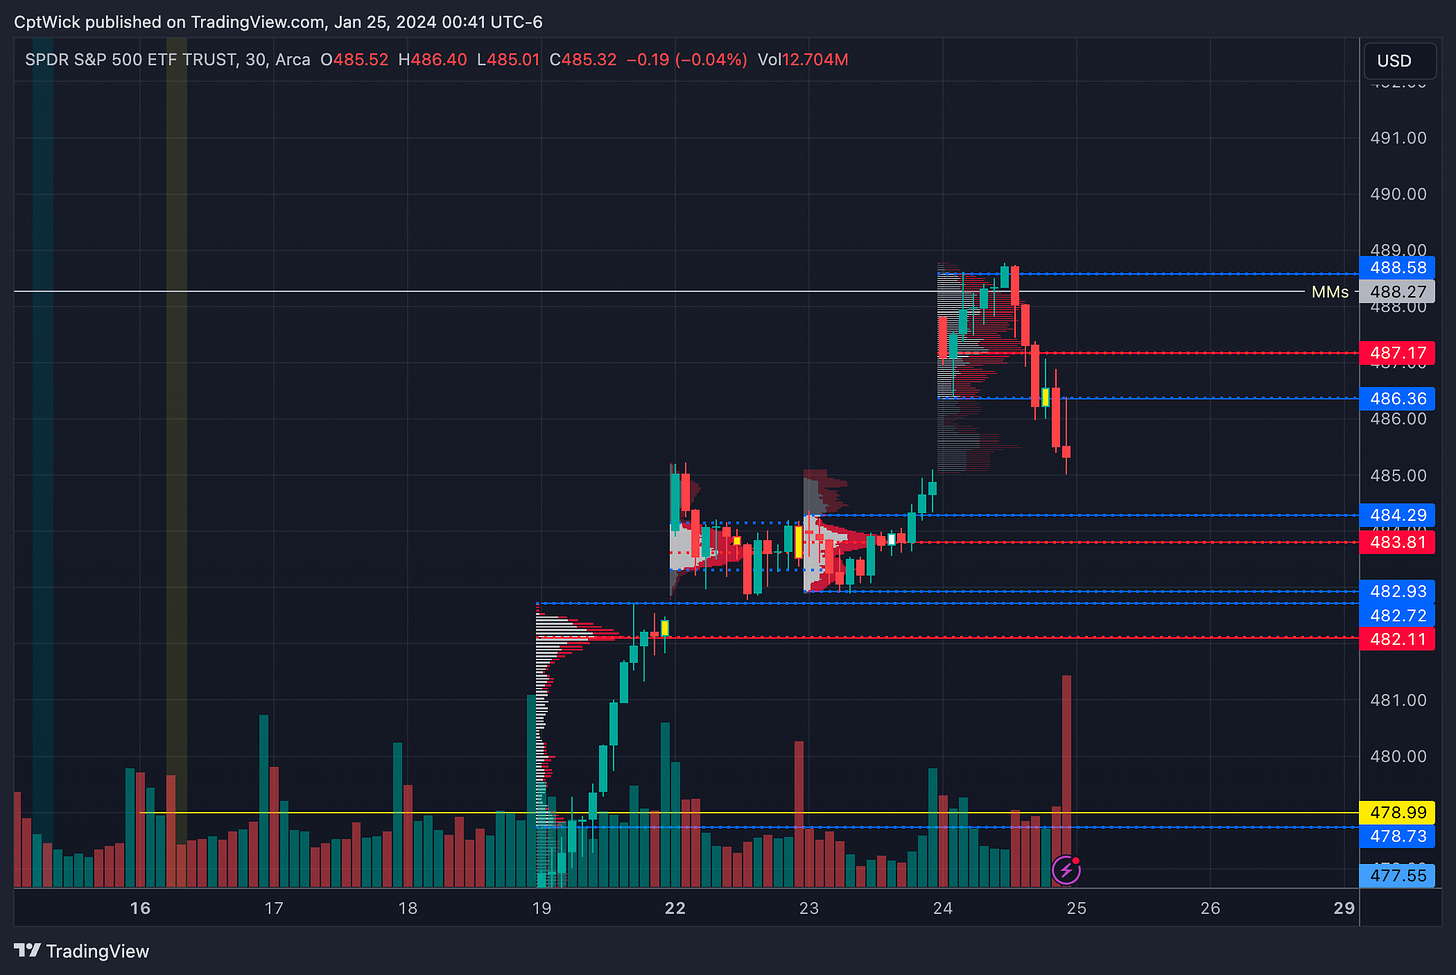
If we zoom in down to the 30min you can see, we closed the day at an imbalance to the downside. So hypothetically, if we open flat, in between yesterday’s VAH at 486.36 and Tuesday’s VAH 484.29 my plan is to sit and wait for price to come up or move down to one of these two levels first. Once it trades one of these levels I will then determine if act as support/resistance or if they flip script.
I also think that the area from 484.29 to 482.11 is absolute key for the bulls to defend. If you’re a bull and we lose this zone, you might need to pay attention.
I think I might look for a bounce out of this zone if they give it to us.
Key Levels of Support (using the close on 1/24 485.39)
S1- 484.29-483.81 1/23 VAH and POC this is also right at the current weekly POC
S2- 482.93-482.11 1/23 VAL 1/19 VAH and POC this is also right at the current weekly VAL
S3- 480-478.99 psych level and last week’s VAH (the current 10 SMA on 1D is 478.94)
S4- 477.55 December’s VAH
S5- 476.59 MMs weekly expected low as well as the current January VAH
Key levels of Resistance
R1- 486.13-486.36 Current weekly VAH and 1/24 VAL
R2- 487.17 1/24 POC
R3- 488.27-488.58 MMs weekly expected high and 1/24 VAH
R4- 490 psych level
QQQ
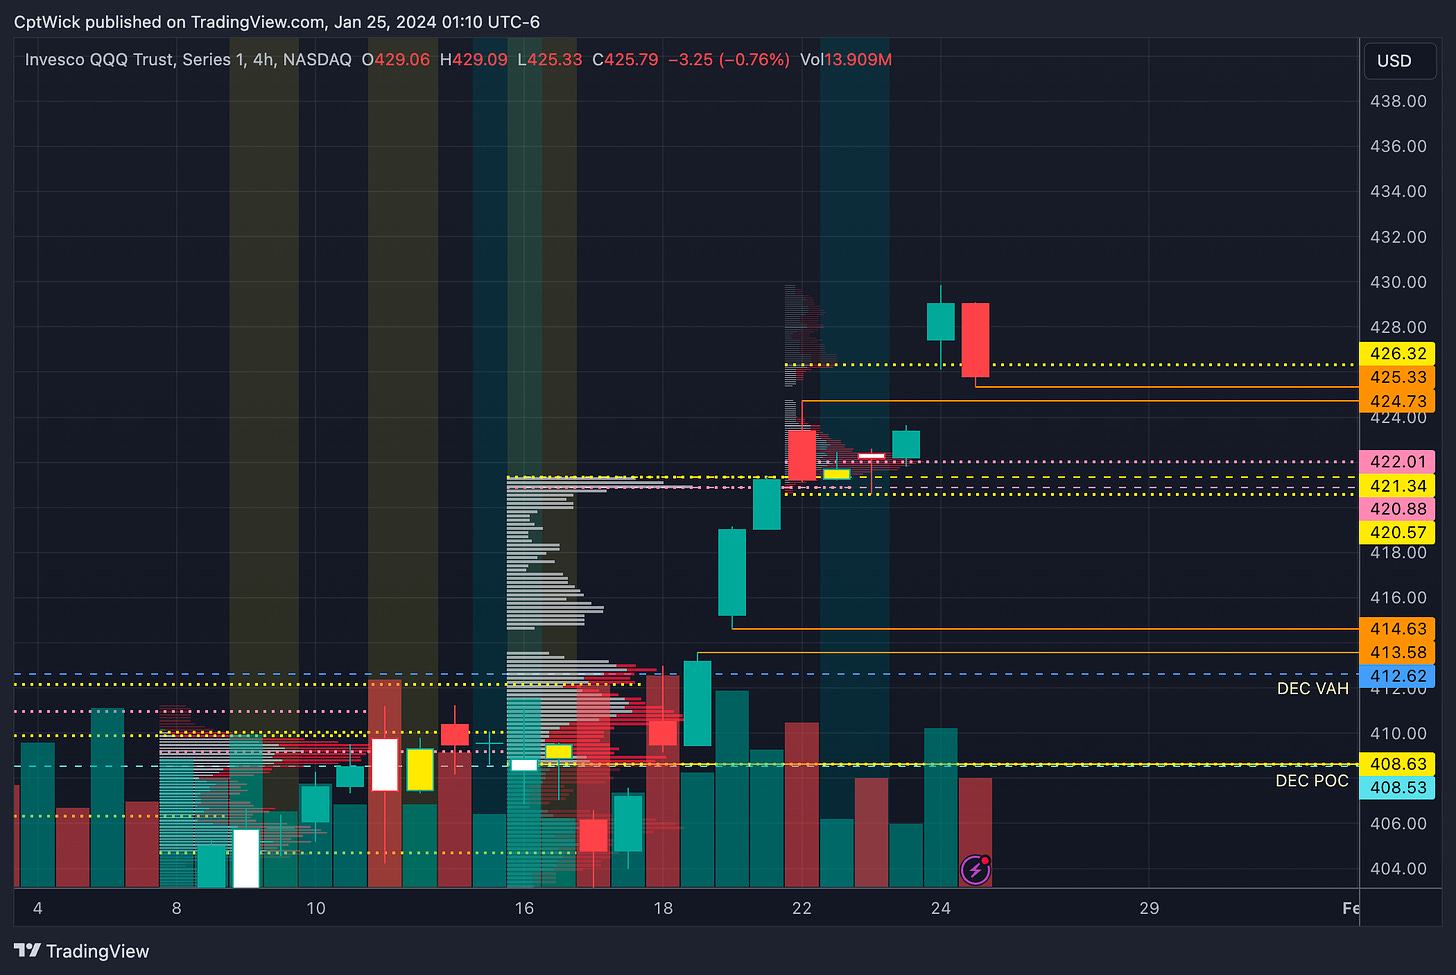
Here is the current weekly profile on QQQ, just like with SPY, QQQ closed the 1/24 session inside of the weekly balance after making an attempt to create an imbalance to the upside. We sold off right around the 430 psych level we talked about with the weekly plan.
There is a small gap that could be filled during the RTH session from 425.33 to 424.73.
Key Levels of Support
S1- 425.60-424.73 1/24 VAL and a 4hr gap fill RTH
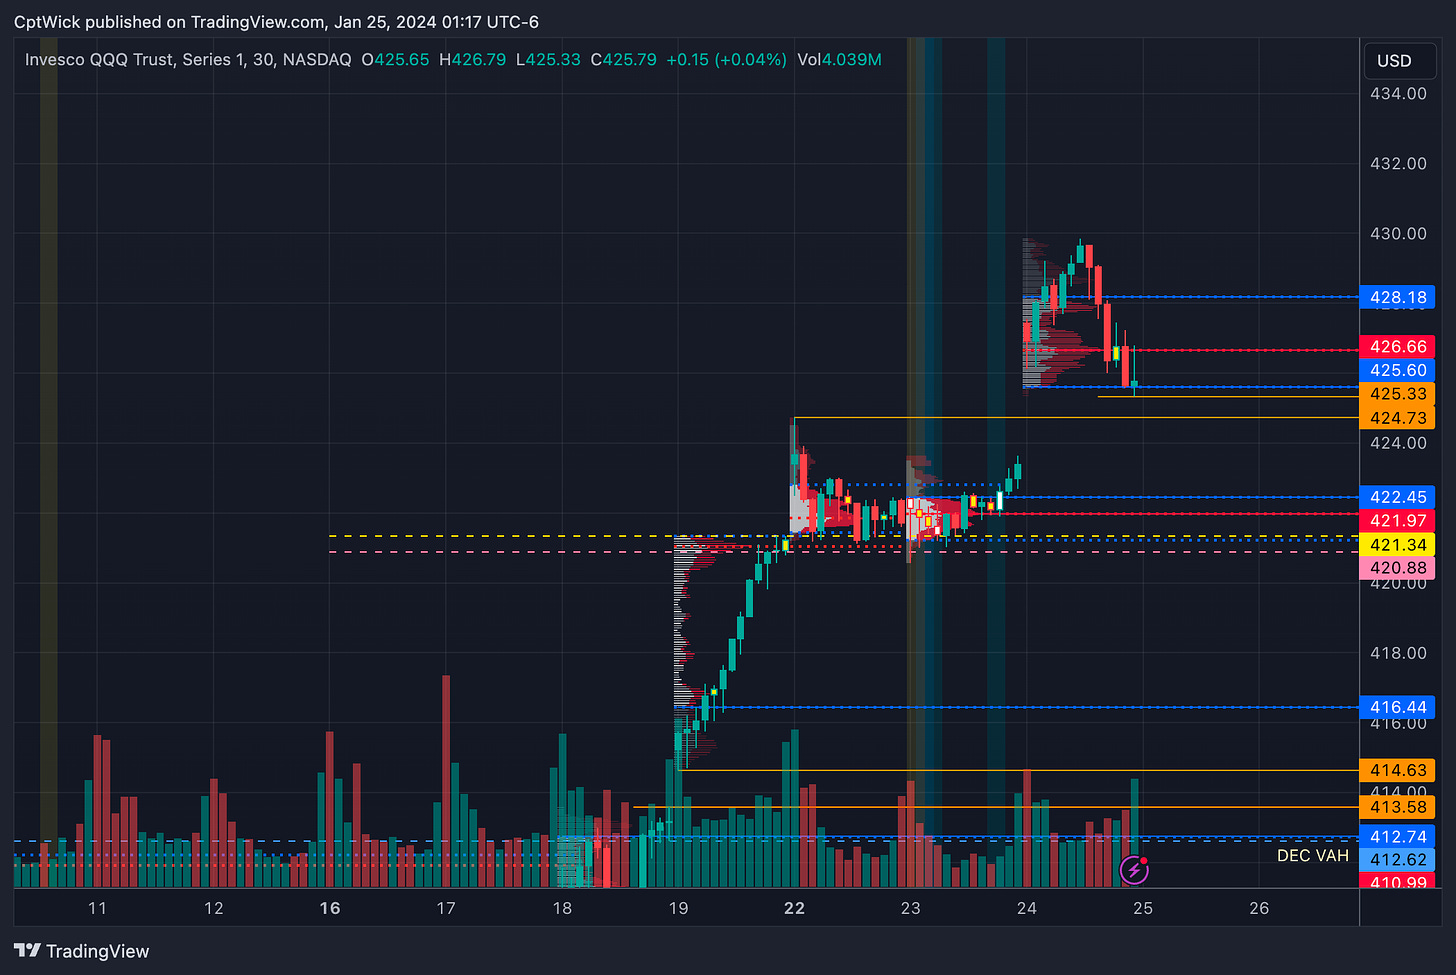
S2- 422.45-421.97 1/23 VAH and POC (also the current weekly POC)
S3- 421.34-420.88 Last week’s VAH and POC (this is just like the level we talked about on SPY 484.29-482.11, if you’re bullish, you dent want to see these QQQ fail S2-S3
S4- 416.44 1/19 VAL (we could catch a bid somewhere between 420.88 and 416.44) Some fibs from Friday’s low to high are 419.78, 418.77, 417.98, 417.19 (I will include a chart below
S5- 414.63-413.58 this would be a very high level of interest if we get here, it’s a gap fill on the 4hr chart
Key Levels of Resistance
R1- 426.32-426.66 Current weekly VAH and 1/24 POC
R2- 428.18 1/24 VAH
R3- 429.85 1/24 HOD and the 430 psych level
R4- IF we get above 430, some levels I’ll be looking at are 431.42, 432.37, 433.39, 434.50 These are fib extensions from 1/23 low to 1/24 high RTH
TSLA
If you’re not following me on X (formally Twitter) @CaptainWick I would appreciate the follow! I like to post plan recaps there for more engagement.
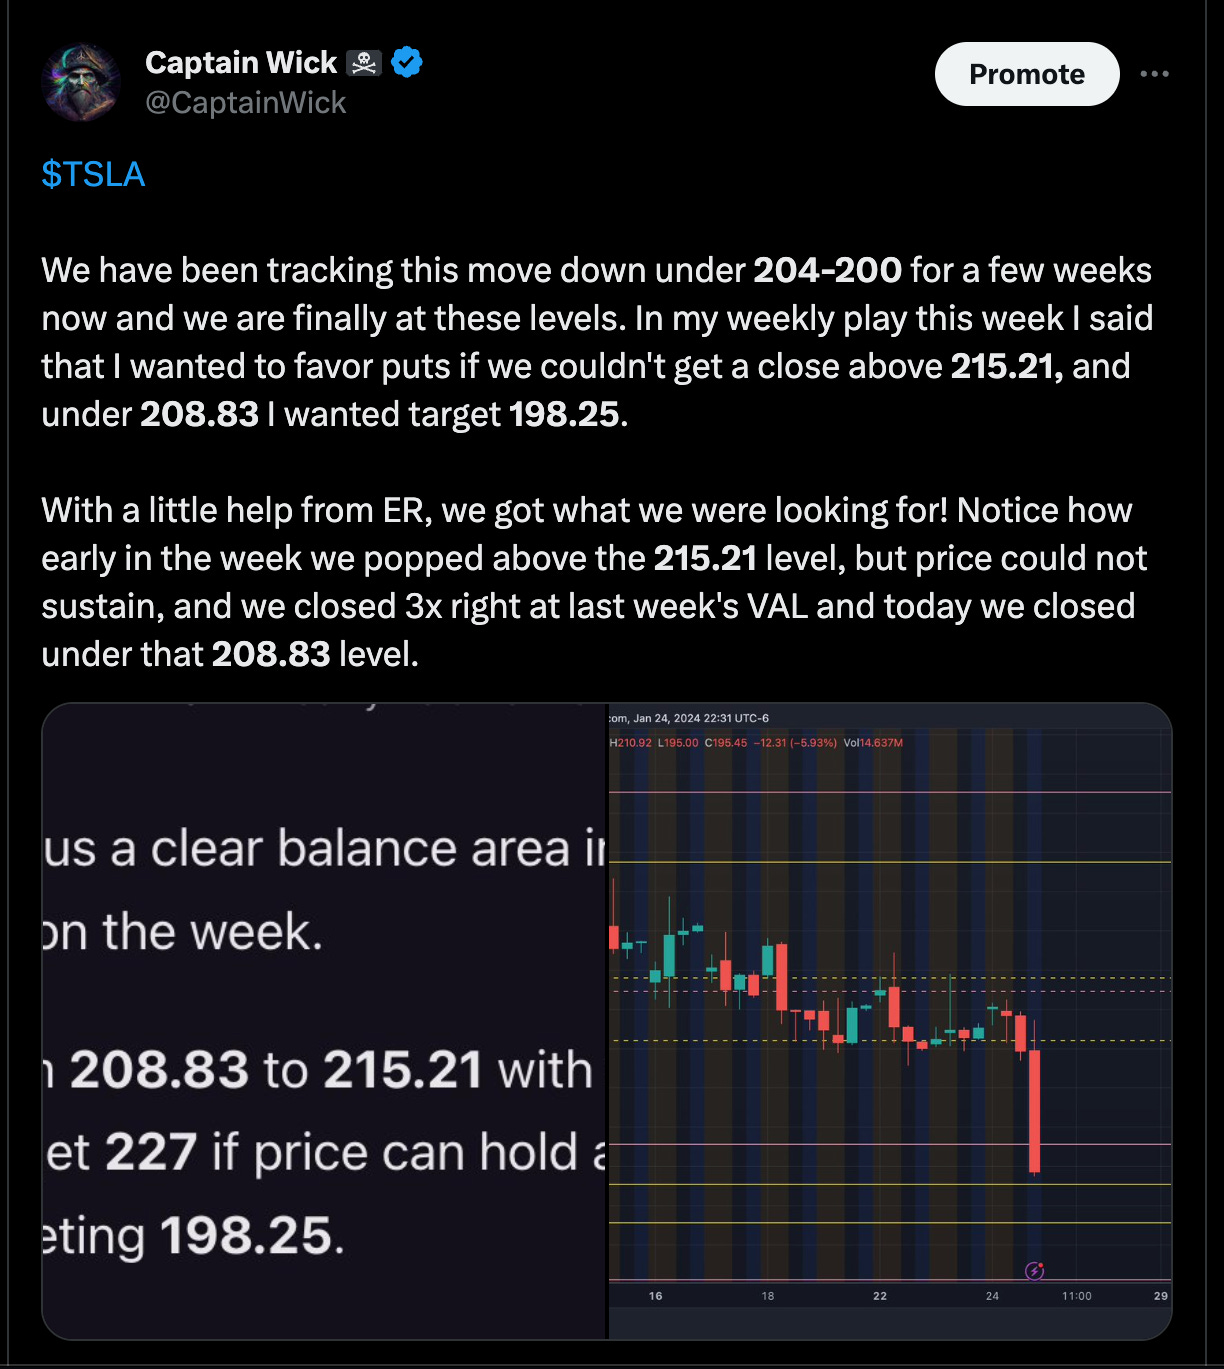
Back a few weeks ago when we started adding TSLA to the trade plan I said that things could get ugly under 228-227 and now here we are after hours in the 195s. ER played a role in getting us there, but the price action was extremely bearish on this one.
There were days that SPX and NDX were soaring to new highs and TSLA was red on the day. Volume Profile is a powerful tool when you use it conjunction with other factors.
This one might need a day or two to balance out and I don’t know where we will open up on 1/25.
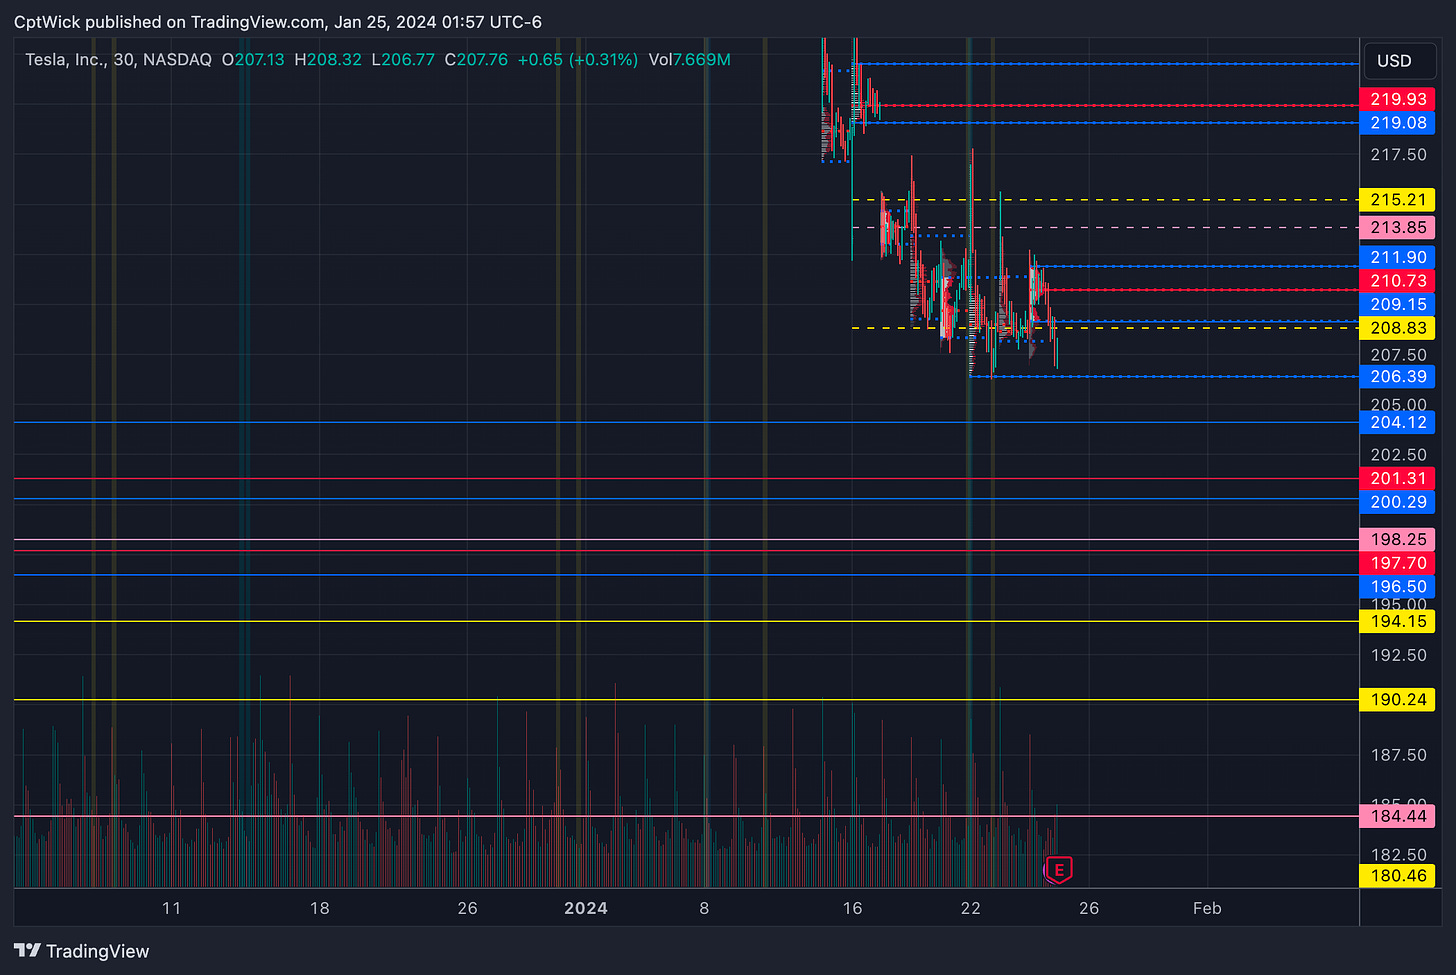
I am going to post some levels here that I think are important, but they might not necessarily be support or resistance based on where that open is.
Key Levels
The first level I want to talk about is 195. This is about where price reached in the true afterhours session.
194.15 weekly VAL from the beginning of November and the POC is currently above us at 198.75
The next naked weekly value area is at 190.24 to 180.46 the POC sits at 184.44 This zone is going to be very very important if we see it. Under this opens the door to 168.57, but we could find support around 175.45-172.
Above 194.15 the next resistance I have is at 196.50-197.70-198.25
200.29-201.31-204.12
206.39
One other thing to point out the 10 SMA on the 1D timeframe is currently 216.54, we are extremely extended away from this value. This could cause a rally towards this value to try and close the gap we have made from it. Not financial advice, just stating my opinion.
Happy Trading,
—WICK—
To cover our basis…
Welcome to my Substack where I provide a daily trading plan to help guide my intraday trading. The purpose of this letter is not to advise you on your trading or investment decisions. I am simply documenting my daily trading plan for myself to help with planning and execution. These are simply my opinions and the data sourced from the likes of vol.land, TradingView, Quantdata.us and others. The stock market is risky, gains are not guaranteed. This is not about getting rich quick but learn to educate yourself and make the necessary financial decisions on your own. This is not financial advice.

