Take Control of Your Trading Strategy with Volland
Don’t just react to market changes—anticipate them. By understanding option dealer positioning through Volland’s comprehensive tools, you gain insights that can highlight critical levels, potential market support and resistance zones, and shifts in momentum. Ready to see how dealer flows can drive market moves? Upgrade your plan with Volland to access real-time data, leverage the insights of delta, gamma, and vanna hedging, and put yourself on the proactive side of trading.
USE PROMO CODE: DARKMATTER10 for 10% off your first month!
If you have any questions about the subscription plans or Volland in general. Please reach out. DarkMatter and myself have been leveraging the data provided by Volland to capture some amazing market moves. You too can elevate your trading using the power of this data! The discord has over 2600 members! What are you waiting for!?
For more information head over to Volland!!
TL;DR: Weekly QQQ Plan Summary
Outlook: Market is forming a "P" shaped profile on the monthly profile; key to watch for support or breakdown in early November.
Key Support Levels: Critical support zones at 494.43-493 and 489.44-485.
Key Resistance Levels: Watch 496, 498-501, and 505 for potential breakouts. A move above 505 could lead to a target at 509-510.
Market Makers' Weekly Implied Move
Implied Move: $11.91
Upper Range: 507.23
Lower Range: 483.41
Key Observations from Last Week
The shaded box from previous analysis acted as support.
Weekly Vanna Cumulative Chart: Last week, we highlighted that dips into 486-484 were expected to be bought for a move higher.
Outcome: The weekly low was 485.05, while the weekly high reached 500.28.
Resistance at 500: We hit the weekly high on Friday and ended 5 points below the highs. As mentioned in last week's plan, we anticipated sellers near 500, and this level acted as resistance.
Focus on Cumulative Vanna Chart: Pay close attention to the cumulative vanna chart, especially for short-dated expirations, as it provided a clear picture of how the week played out.
Overview
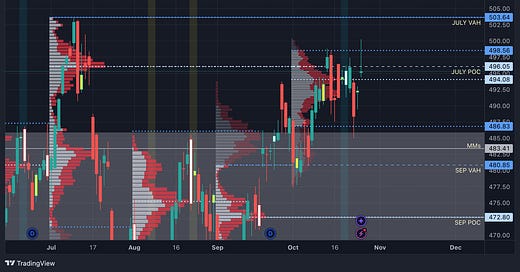
The current monthly profile will close this week, providing new levels to assess.
Fresh monthly candles will be available, which will help update levels going into Friday and November.
We are trading above September’s value area, but the July POC at 496.05 has presented resistance, despite a push into 500 last week.
October Value Area Levels:
VAH: 498.56
POC: 494.08
VAL: 486.83
The current profile appears to be forming a "P" shape. How this finalizes will be significant:
Scenario 1: If the "P" acts as support, it could be a strong foundation for November.
Scenario 2: If the "P" signals weak buyers, we may see further downside. More on this once we enter November.
Longer Term View
Post-Election Outlook: We will gather more information after the election, particularly as October ends and November begins. The first two weeks of November will be critical in determining market direction.
Bulls are currently in a favorable spot, but caution is still advised.
Long-Term Line in the Sand (LiS): The key support level for bulls is around the current October low at 477.40.
Upside Target: A move above 505 could lead to a push towards 515. Updates will be provided as new price levels are discovered.
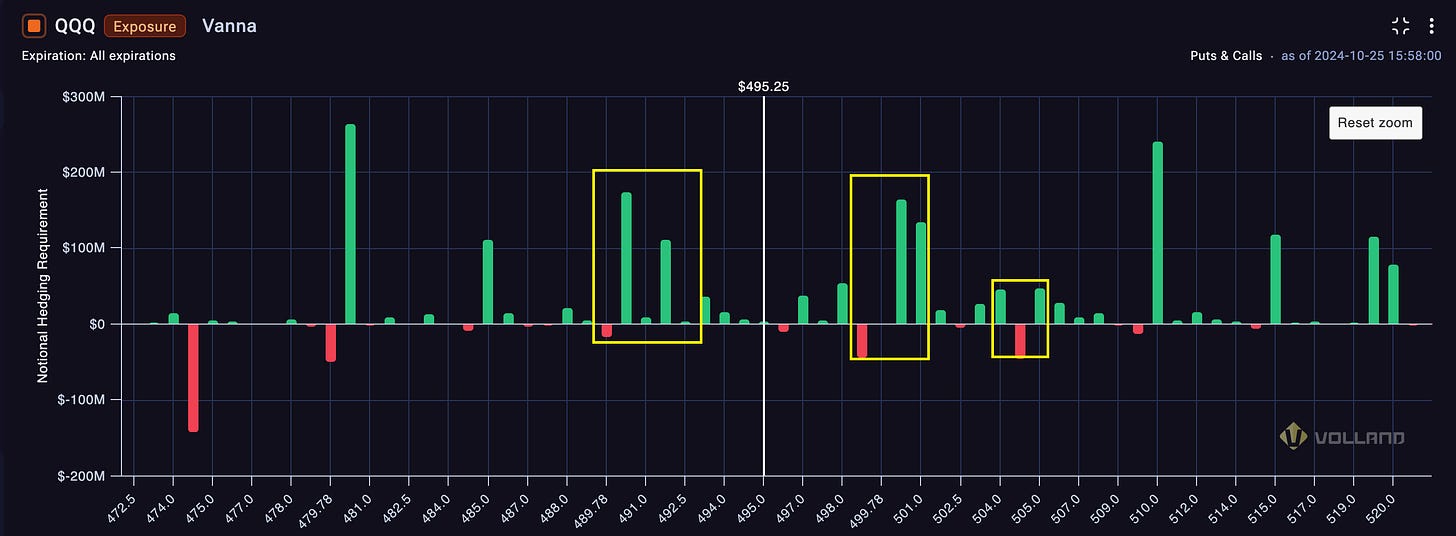
Aggregate Vanna Analysis
Key Strikes
Upside Levels of Interest: 496, 499, 500, 501, 502, 504, 505, 509, 510
Downside Levels of Interest: 493, 492, 490, 488, 486, 485, 484, 480
Analysis
Directly above spot, there is negative vanna at 496. Above this strike, the next area of interest is the negative vanna at 499 and the positive vanna at 500-501.
Beyond 502, the next major resistance levels are 504-505, followed by 509-510.
Below spot, the levels of interest are 493-492, followed by 490. Below 490, the situation could become riskier, but current data suggests potential buyer interest at these levels.
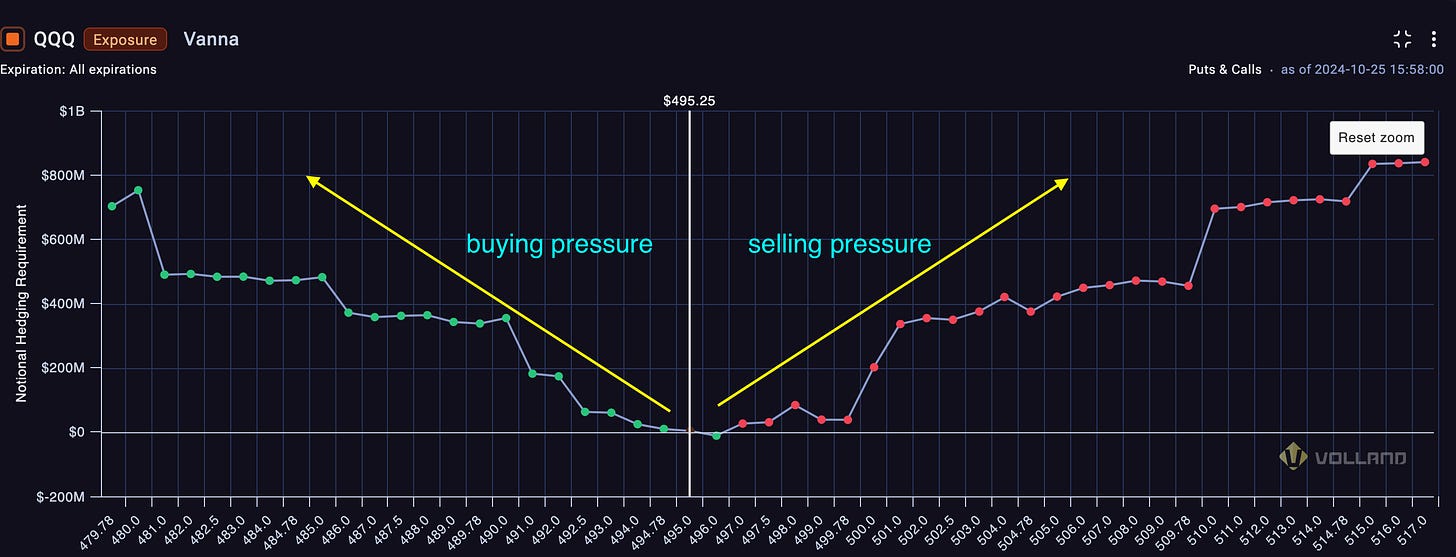
Cumulative Aggregate Vanna Chart
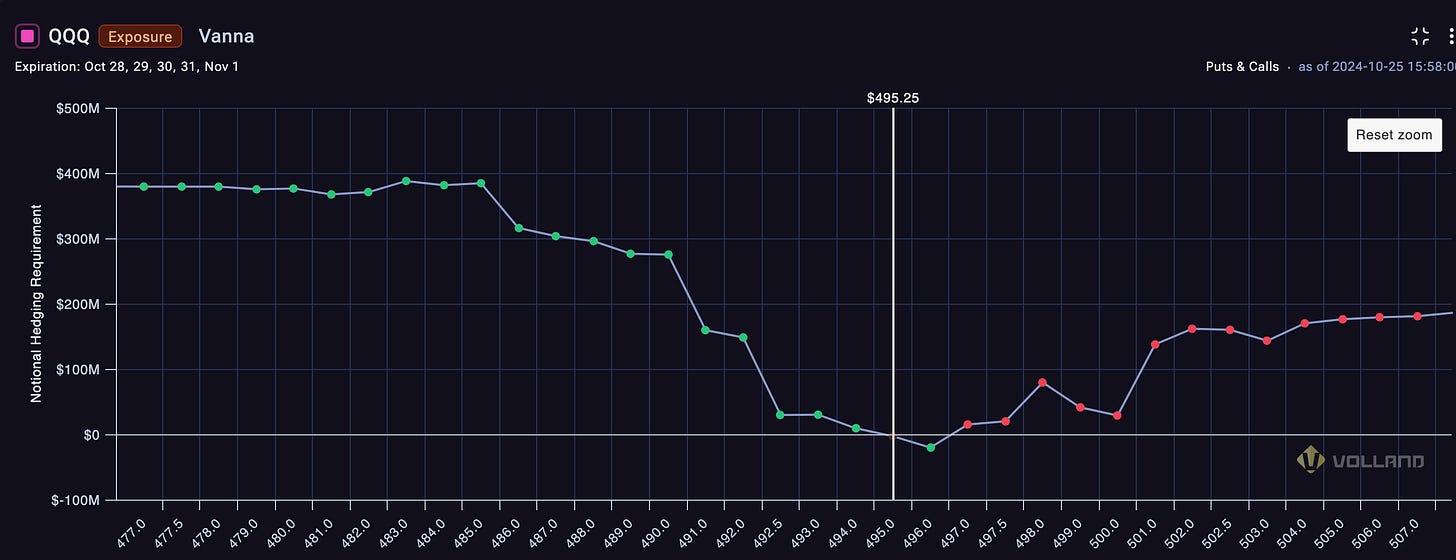
Summary: The aggregate cumulative vanna chart displays an upper V shape. As prices move downward, buying pressure is expected to increase, particularly in the 490-485 range. Conversely, as prices rise, sellers are likely to step in around 501-504.
Overall, it appears we are in a 'buy the dip, sell the rip' environment until further notice.
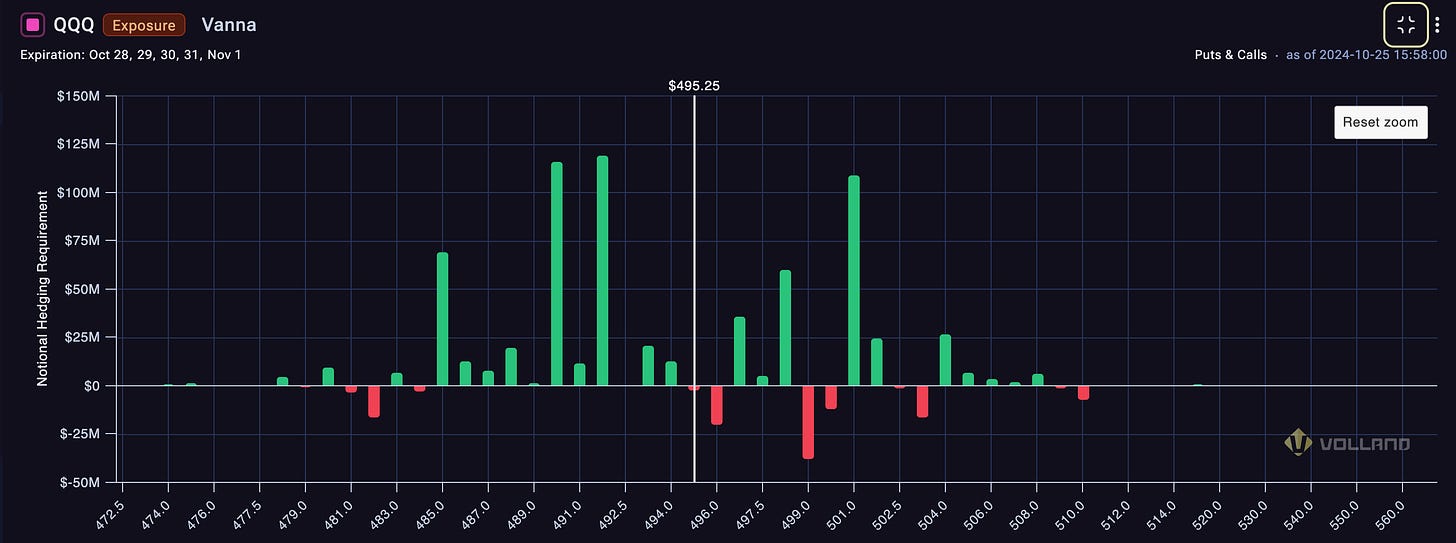
Weekly Vanna Analysis
Key Strikes
Upside: 496, 499, 500, 502, 503, 504, 509, 510
Downside: 495, 492, 490, 489, 485
Cumulative Weekly Vanna Chart
Summary: The weekly expiration analysis suggests buyer interest near 492-490 and potential selling pressure around 498, followed by 501-503.
Key Support and Resistance Levels
Support Levels
494.43-493: This is a gap from Thursday into Friday, an important zone for the bulls to defend. If the price falls below 493, we could revisit 492.11-489.44.
Weekly Cumulative Chart Insight: The chart suggests that if we dip to these levels, dealers should be buying, with increased buying interest as we near 485.
Caution for Bulls: Below 489.44, this could open the door to 485-483.
Resistance Levels
495.32-496.05: This zone represents last week's close and includes July's POC. Negative vanna at the 496 strike suggests that if we move above 496, we could see a push towards 498-501.
498.56: The current monthly VAH. Above this level, the target is 500.28-501.
501: A break above this level targets 503.52-503.64, the current all-time high (ATH).
503-504: Negative weekly vanna is at 503, with aggregate vanna at 504. If bulls move above 505, the target shifts to the MMs weekly high at 507.23, potentially reaching 509-510.
Final Thoughts
Last week’s range was 15 points (485.05-500.28). If the price remains within this range, expect choppy market conditions.
Ideally, we want to see either last week's high or low break first to establish direction.
If the price tests the upper side of this range at 500.28, the key decision is whether it will hold support above this level or fail.
If 500.28 fails and the price falls back below, we could see a move down towards 490 or lower.
If 500.28 is supportive and we breakout above 505, I want to then ultimately target 509-510.
The stock market is risky, gains are not guaranteed. This is not about getting rich quick but learn to educate yourself and make the necessary financial decisions on your own. This is not financial advice.
If you want updates for this plan as the week unfolds. I would love to see you in the Volland discord! If you join, please say hello! Don’t be shy!



I really appreciate the analysis. The Q's are all that I trade.
Targets are difficult, I understand that, I have a spread 485put short 530call December 31 exp.
Do you think we have a meltup/chase at the eoy?
I may adjust my call side.
Thank you.