Readers,
I’m not going to lie we dropped more than I was originally expecting this past week. If you are following me on X, we still caught the move down. Like I’ve said before, you have to know when to cut your losses and move on. Tuesday, I got burned swinging calls, but I had the awareness to cut and flip to puts. I will go into details on what I was seeing here in another section. I didn’t trade on Friday simply because I did not prepare. My wife had a work party, and I was out too late and never got around to charting and I don’t like to enter trades when I don’t know what to expect.
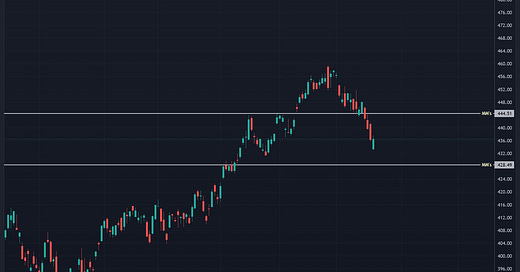
Market Makers (MMs) Weekly Expected Range
The MMs are expecting a weekly move in SPY of 8.01 this week.
444.51 High
428.49 Low
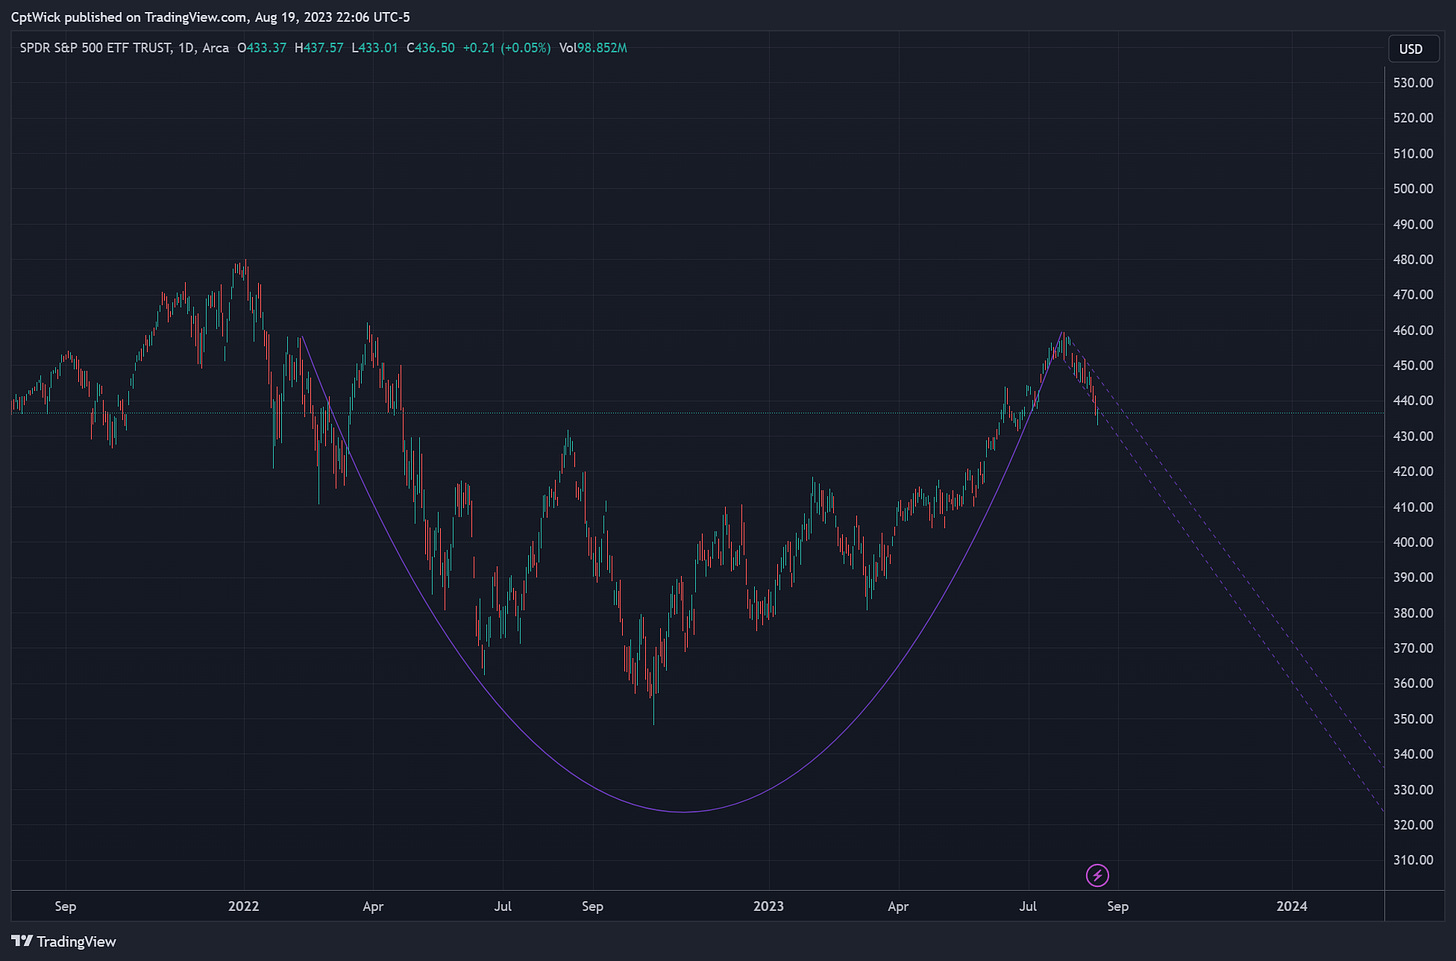
I see some people calling this a big ole cup and handle…
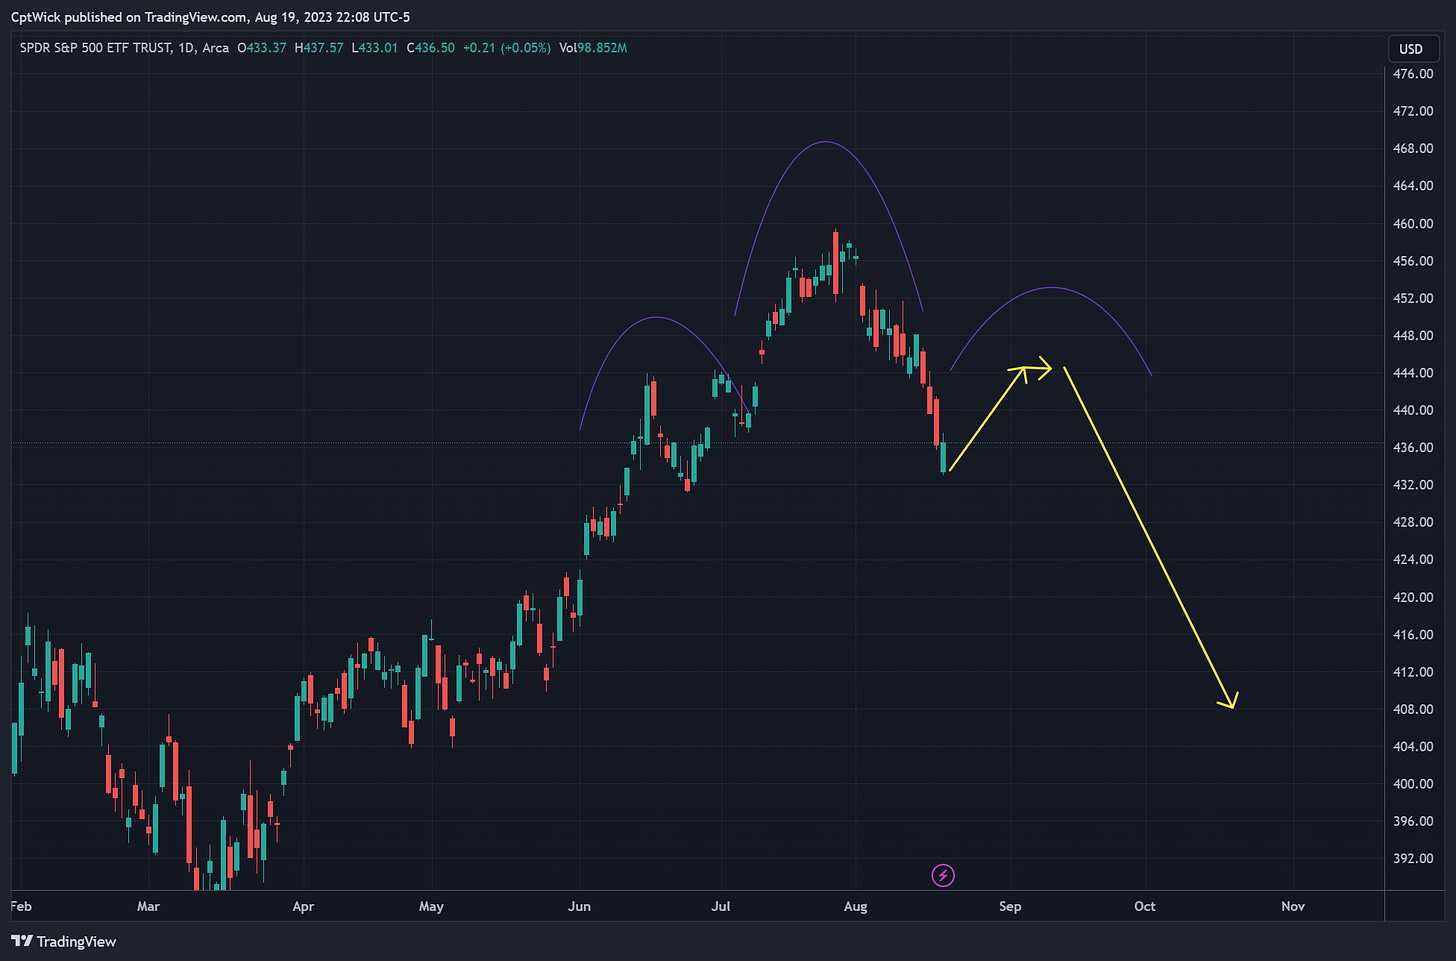
I see some calling it a potential head and shoulders forming…
What is it going to do? You tell me…
I want to recap my thought process and break down to you why we had to flip out of calls and into puts after Monday.
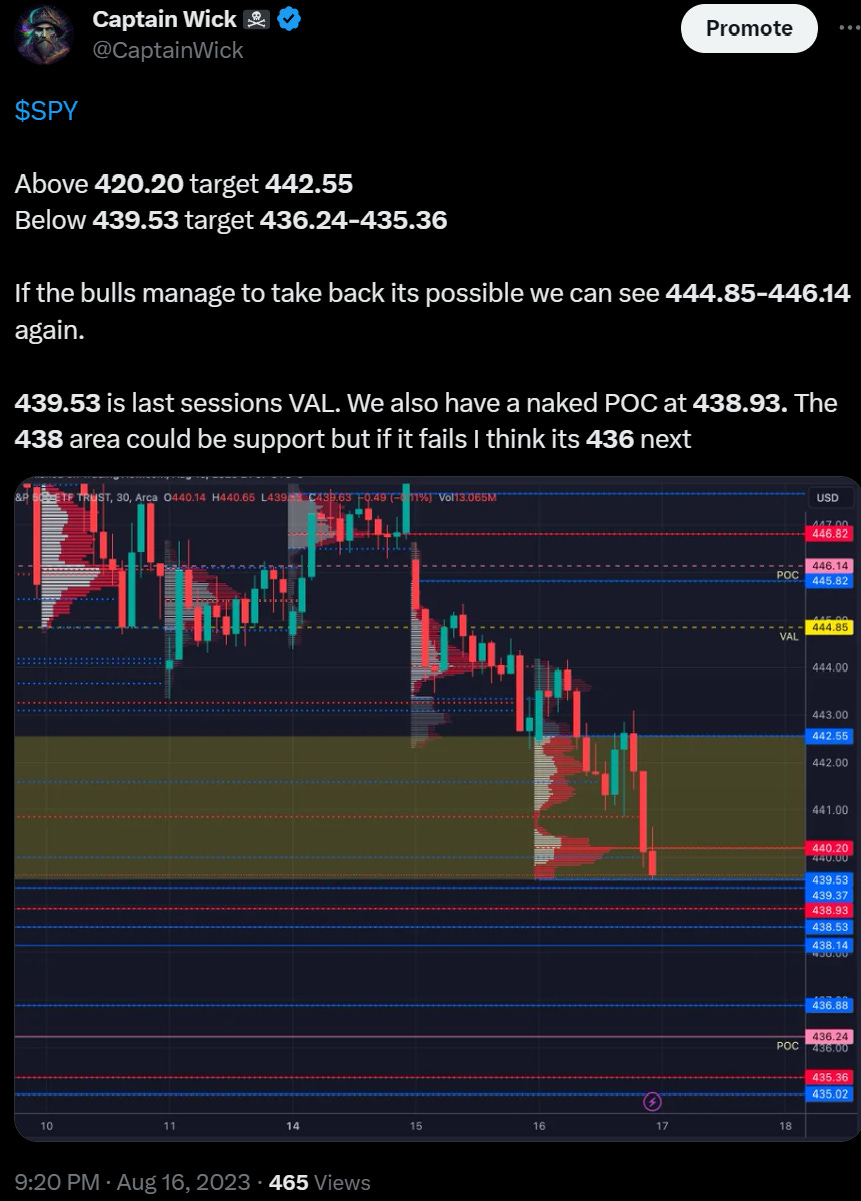
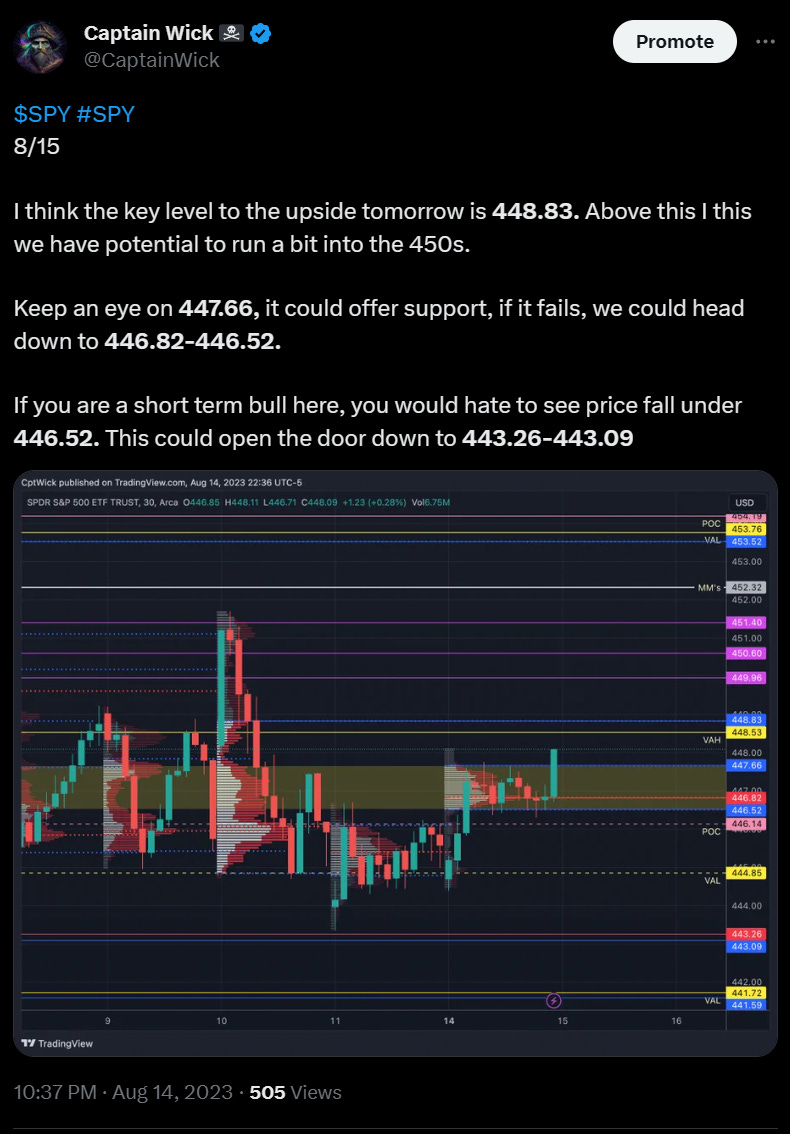
Here is the post I sent out on X, Monday night preparing for Tuesday’s session.
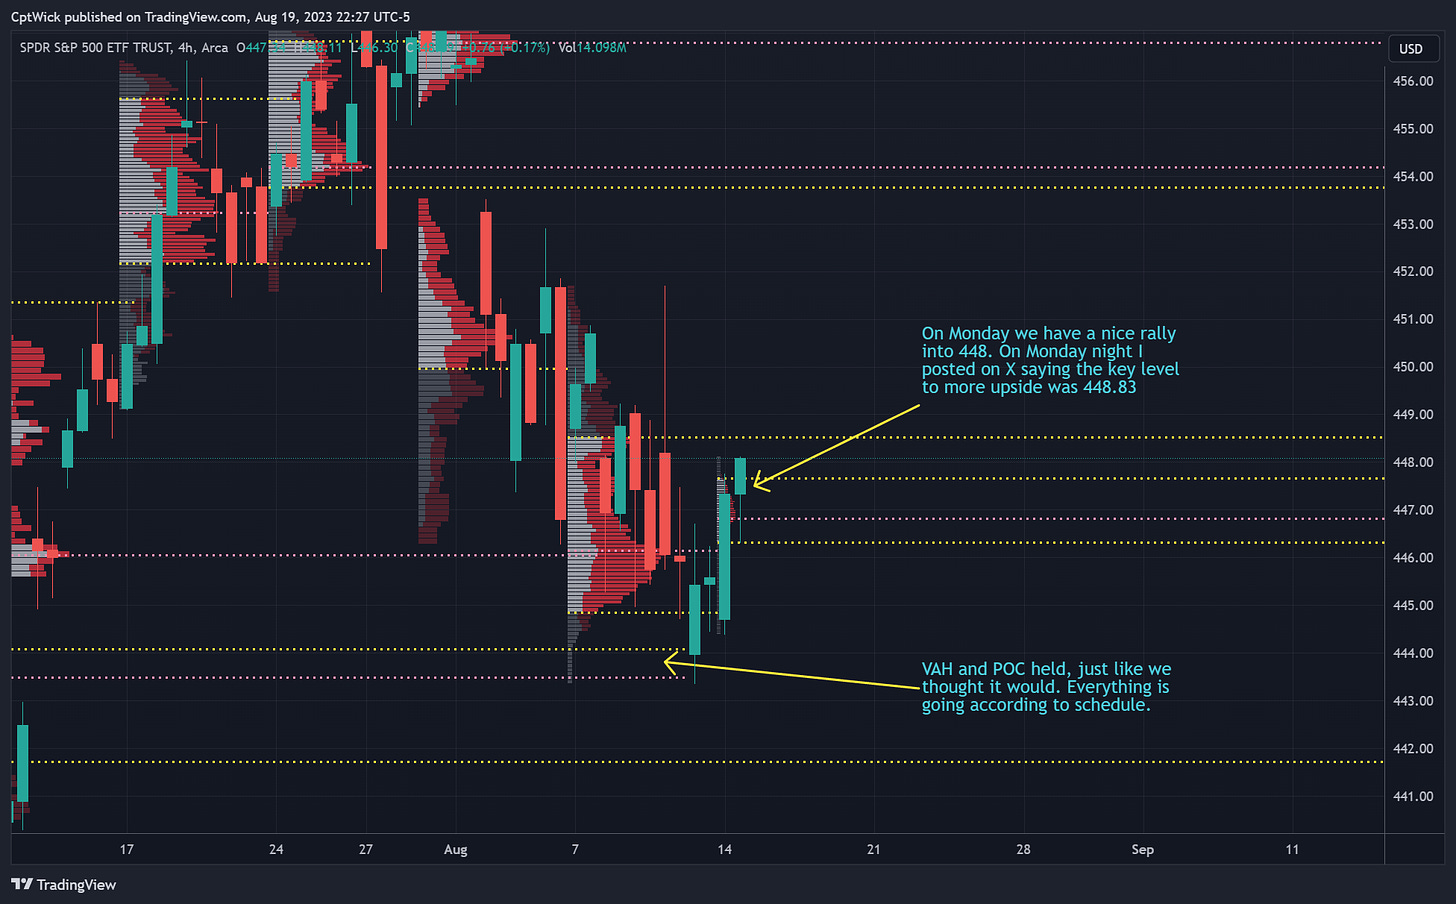
Here is a breakdown of the weekly profile chart on what I was seeing that night.
I was hoping of an open above 448.53 (last week’s VAH), we also had a daily VAH sitting at 448.83 which is why I chose that level. Unfortunately, when the market opened on Tuesday, we gapped down to 446.27, we ended up losing 446.52, and if that happened, I wanted to target 443.26.
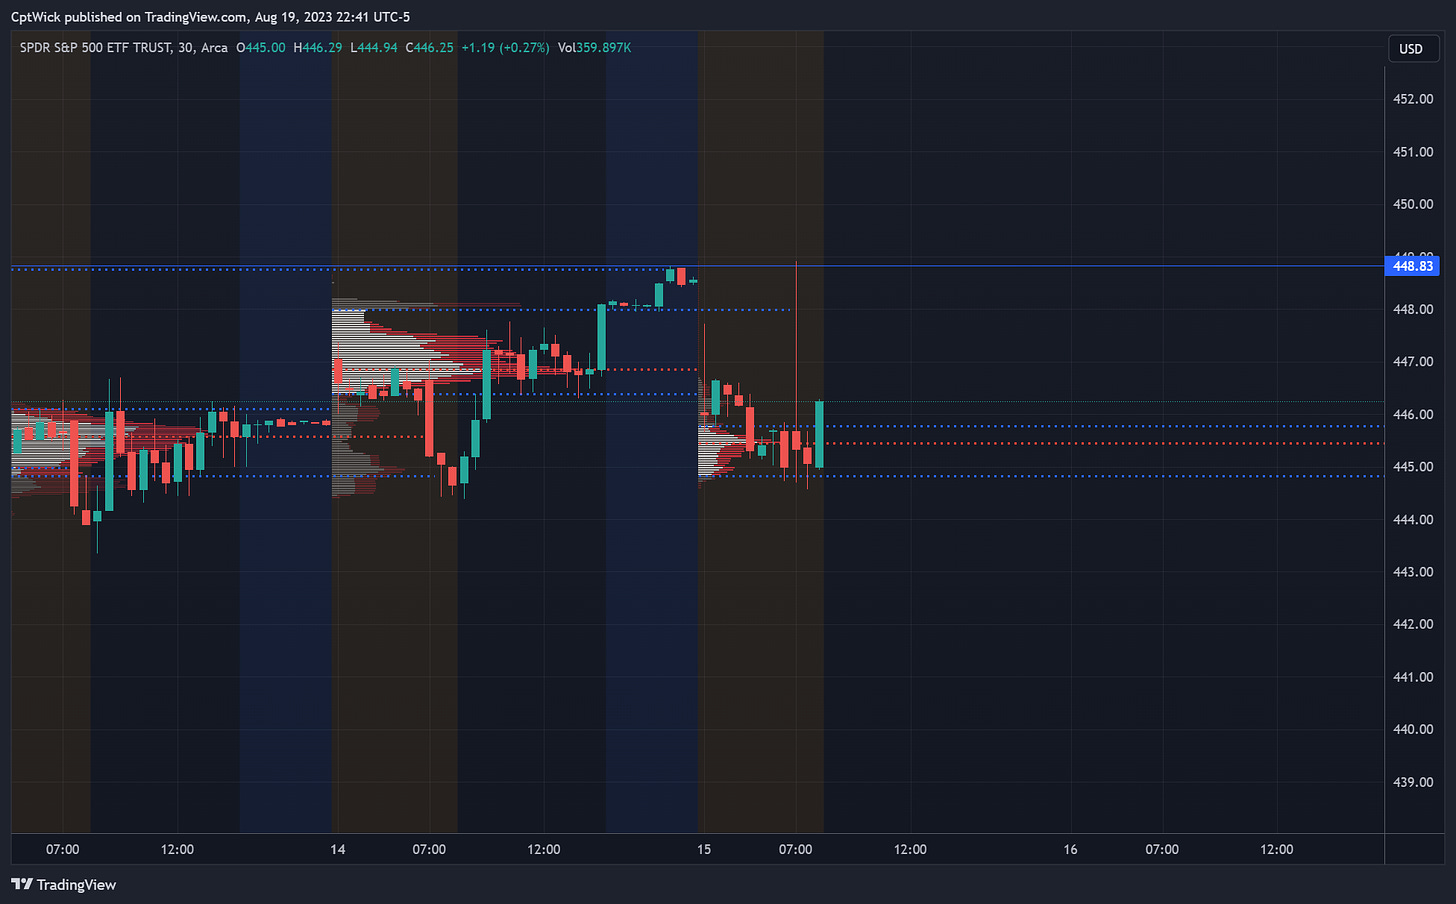
You can also see that in the pre-market session, we hit that 448.83 level I posted about on X the night before.
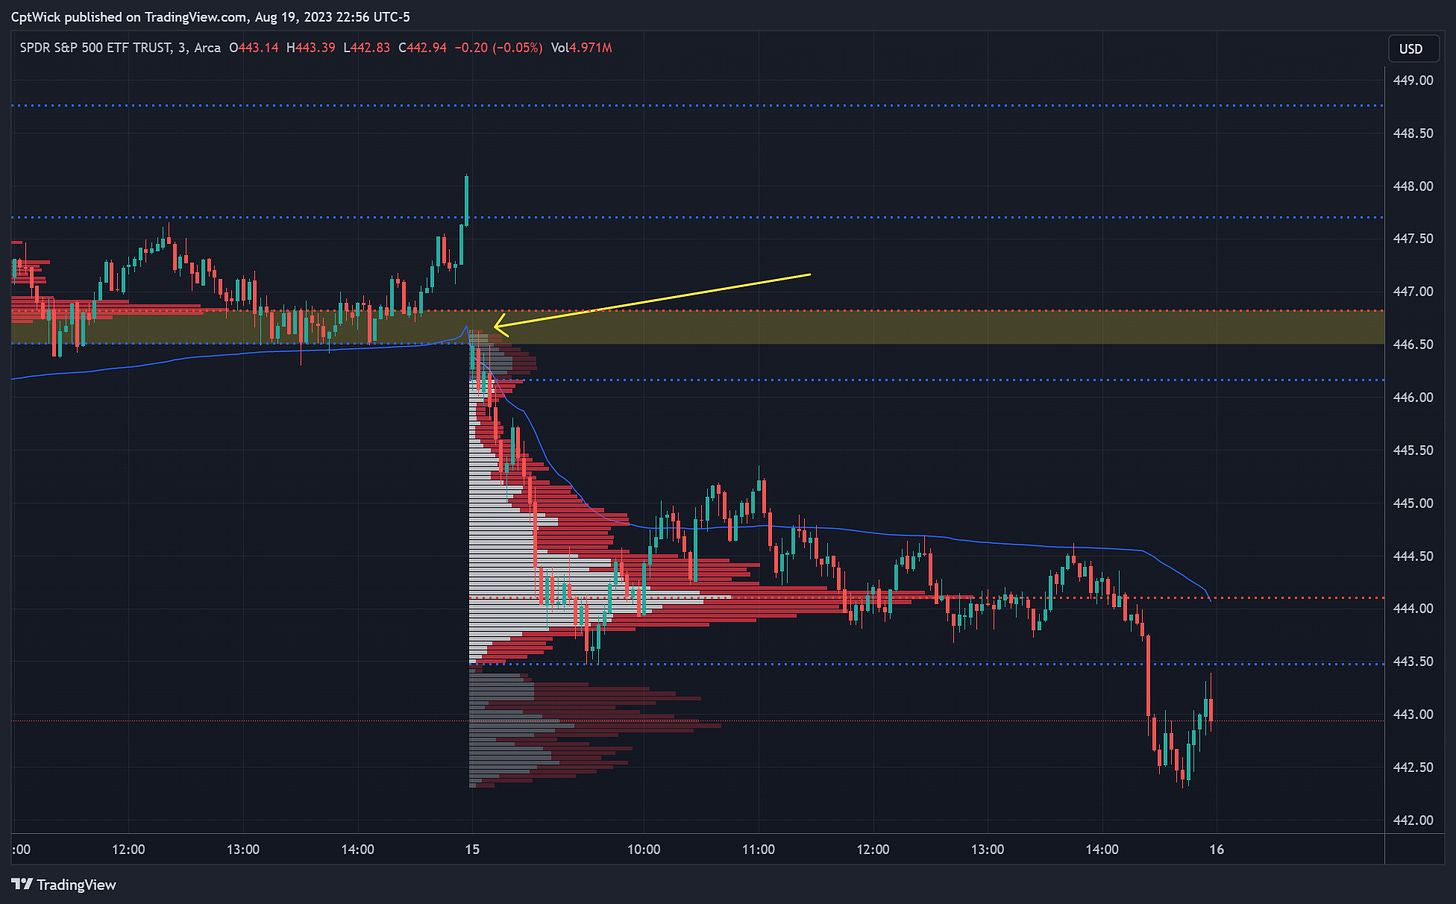
Five minutes before the open on Tuesday 08/15 (Chicago time), I sent this post on X, saying to watch 446.50.
At open, price came right back into that level and proceeded to selloff, hitting our target of 443.26-443.09 and giving us 442.30.
I knew I had to change my stance once this even occurred. In my Weekly Plan, I said this,
I warned that under 441.72, it gets bad. So now going into Wednesday, all eyes are on 441.72, and you know how the rest of the week went.
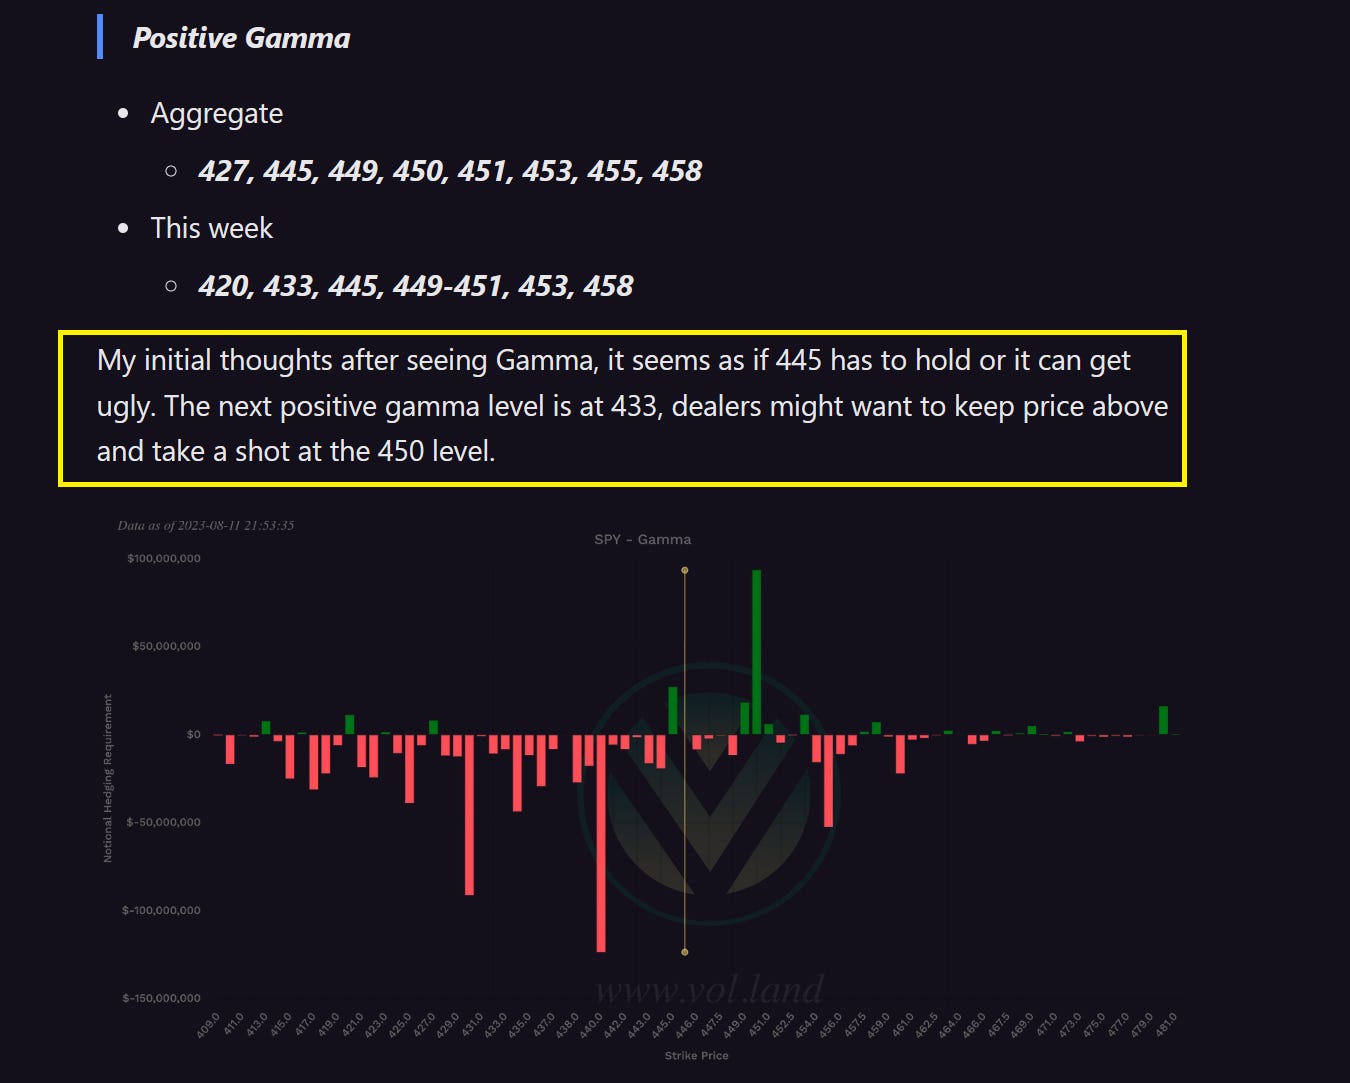
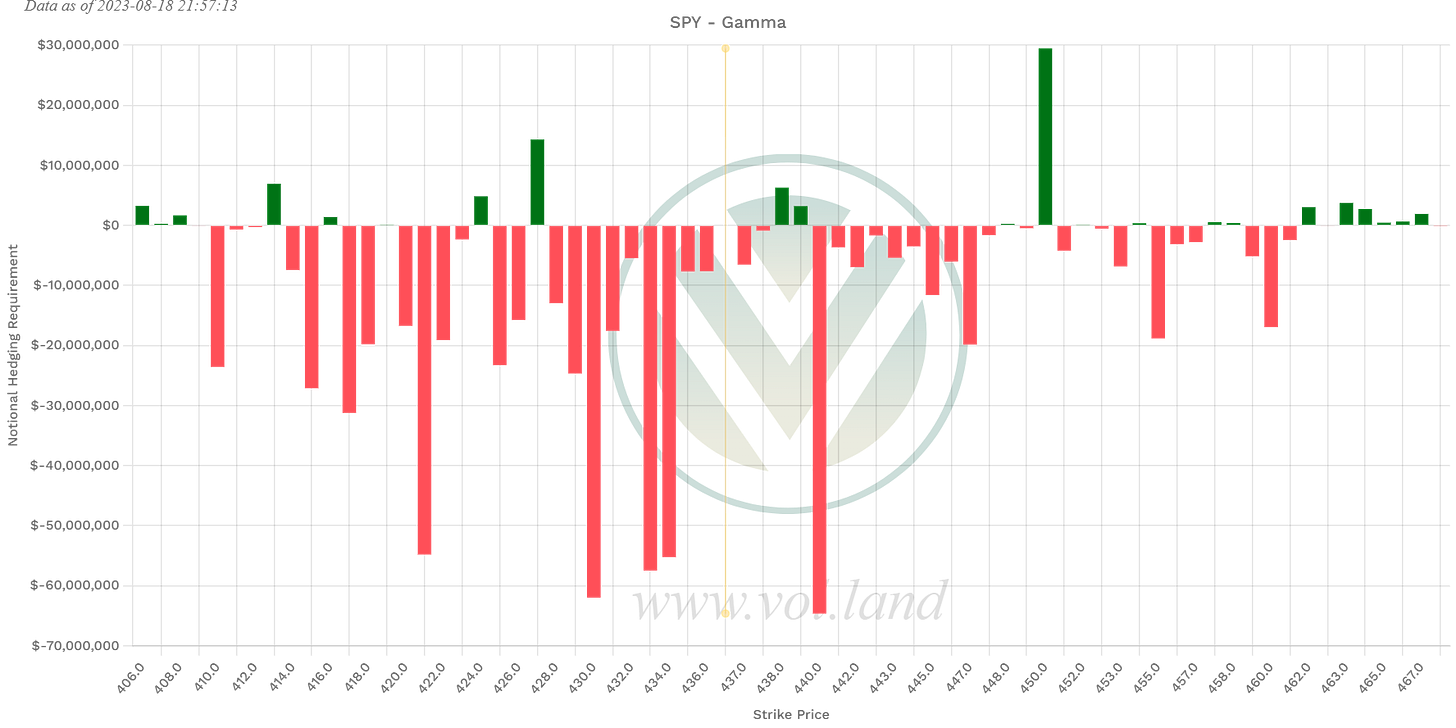
Something else I want to point out, in the Volland section of my plan on Sunday I said that the next area of interest under 445 on a Gamma perspective was 433.
Because I’ve seen this look before, I figured that 445 would have been support, hence my bullish stance to start the week. We knew that 433 could be possible area of interest based on this data. The weekly low was 433.01, coincidence?
I wanted to share this info with you all because I felt it is important to not get married to a trade or an idea.
If I am trading, I will always post my levels on X. If I don’t post levels for the next trading session, I will not be trading, keep that in mind. Back to the plan.
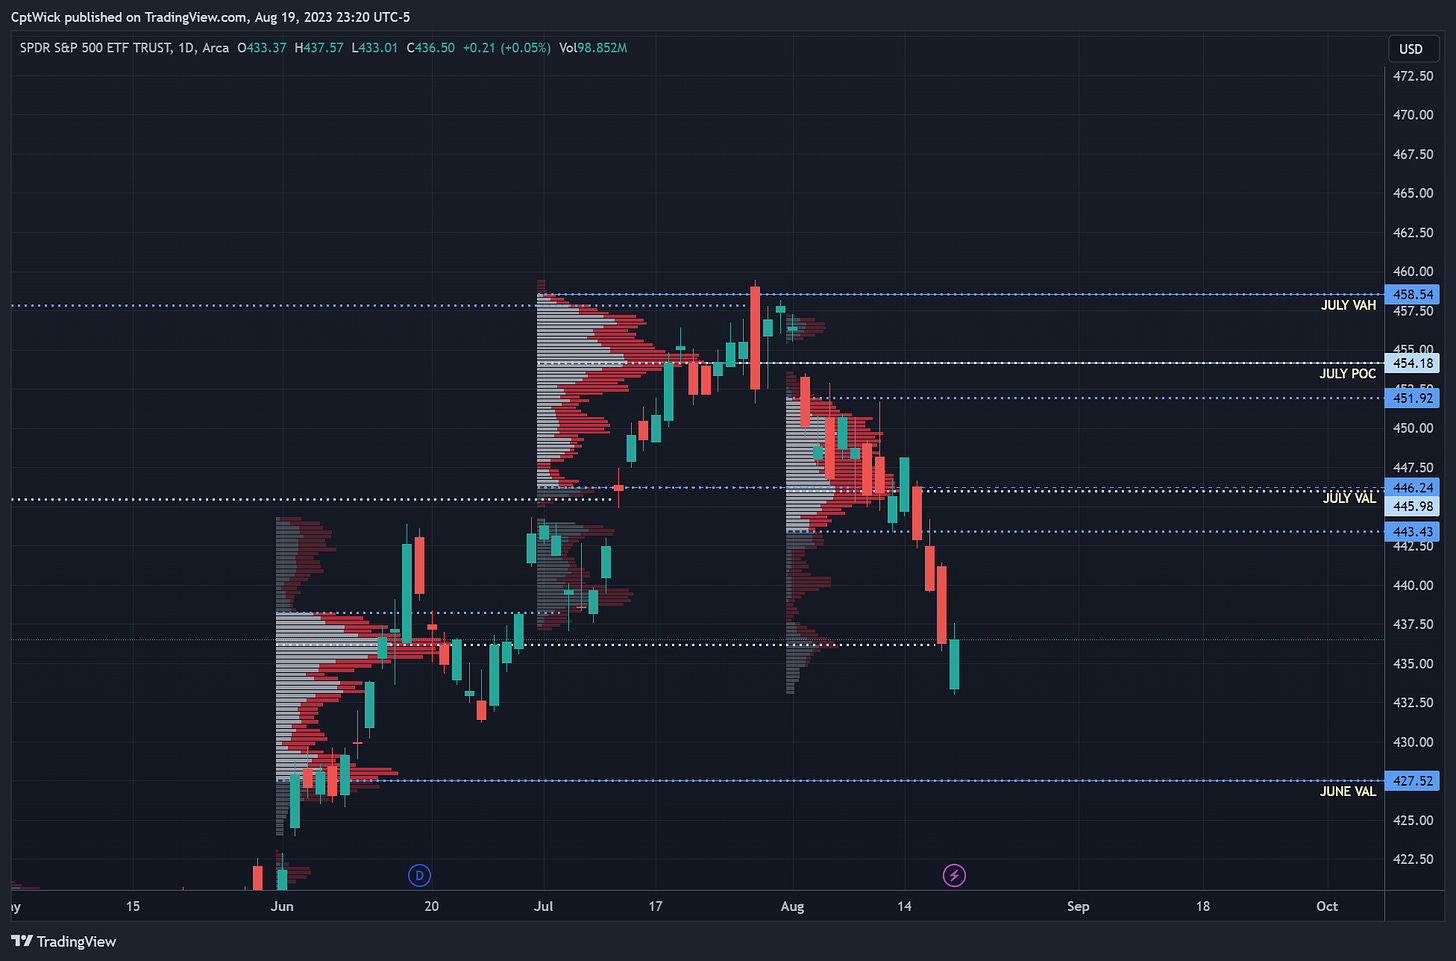
Monthly Volume Profile Levels
Current Value Area
451.92 Value Area High (VAH)
445.98 Point of Control (POC)
443.43 Value Area Low (VAL)
July’s Value Area
458.54 VAH
454.18 POC
446.24 VAL (Breached)
Notable Naked Levels
427.52 June VAL
411.56 May POC
409.77 May VAL
On the monthly profile, I apologize, last plan I didn’t include the June POC and June VAL in the notable naked levels section, but they were included in the screenshot.
You can see that this month’s current POC is basically sitting at last month’s VAL. July’s VAL was a big level to lose for the bulls. It created an imbalance to the downside forcing price to seek June’s value area where we currently sit.
If price continues down, we need to be mindful of the 427 area.
443-446 is still an important area to watch as well.
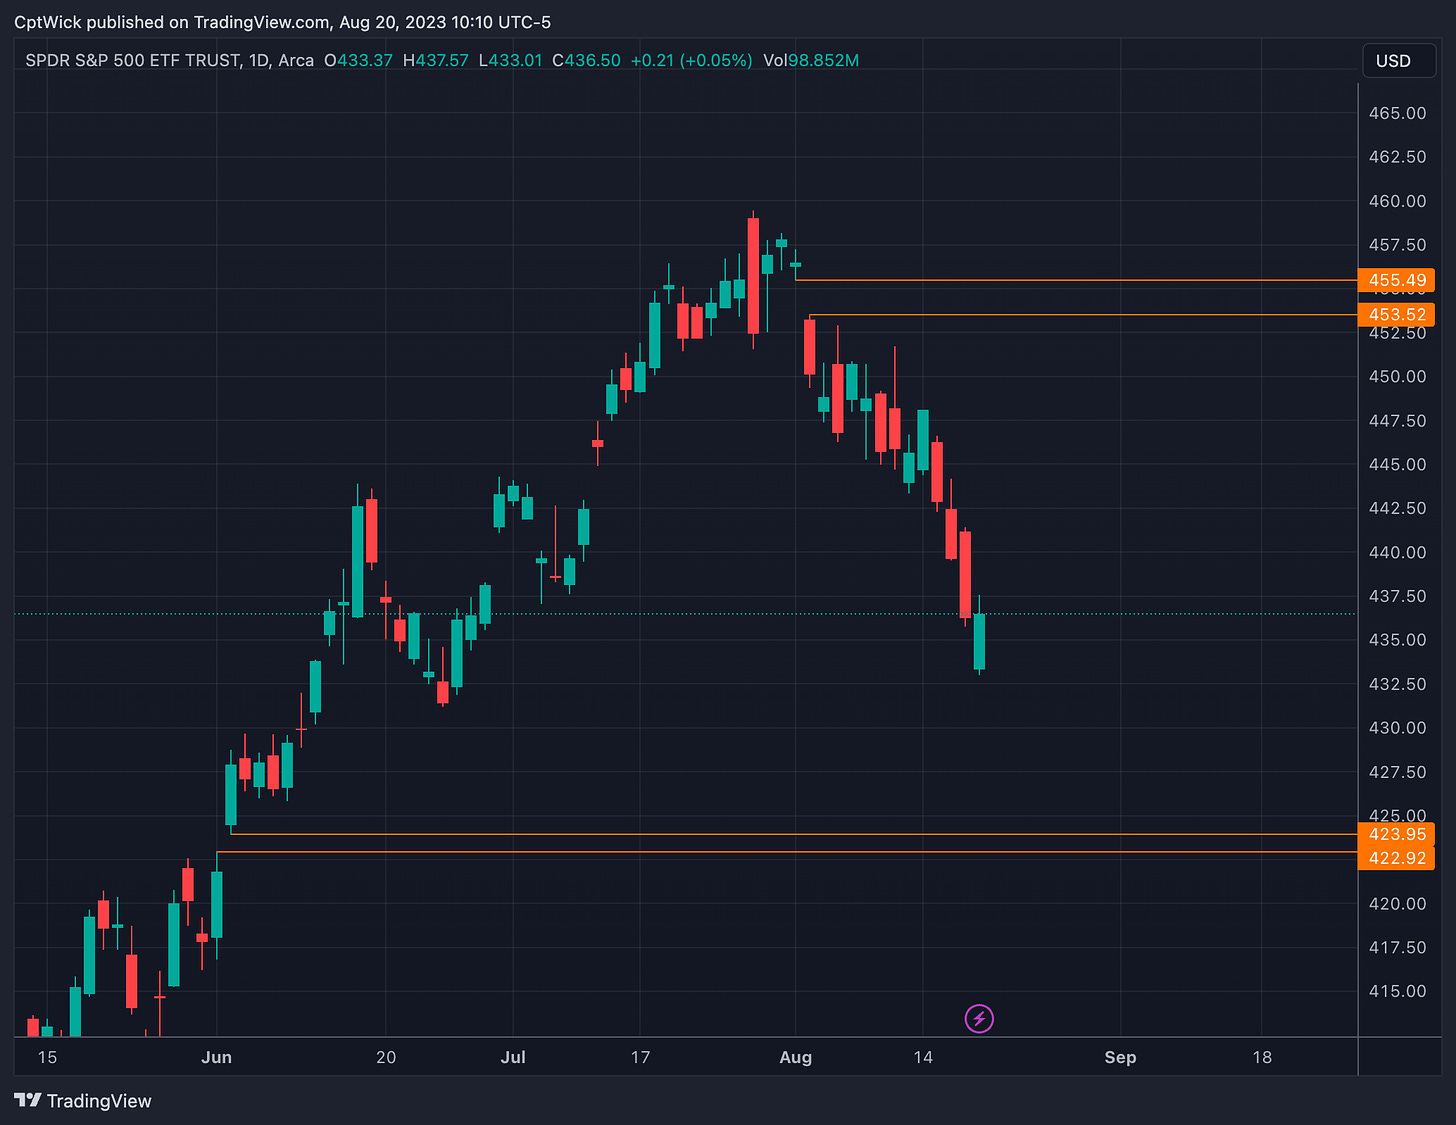
We have two notable gaps on the chart.
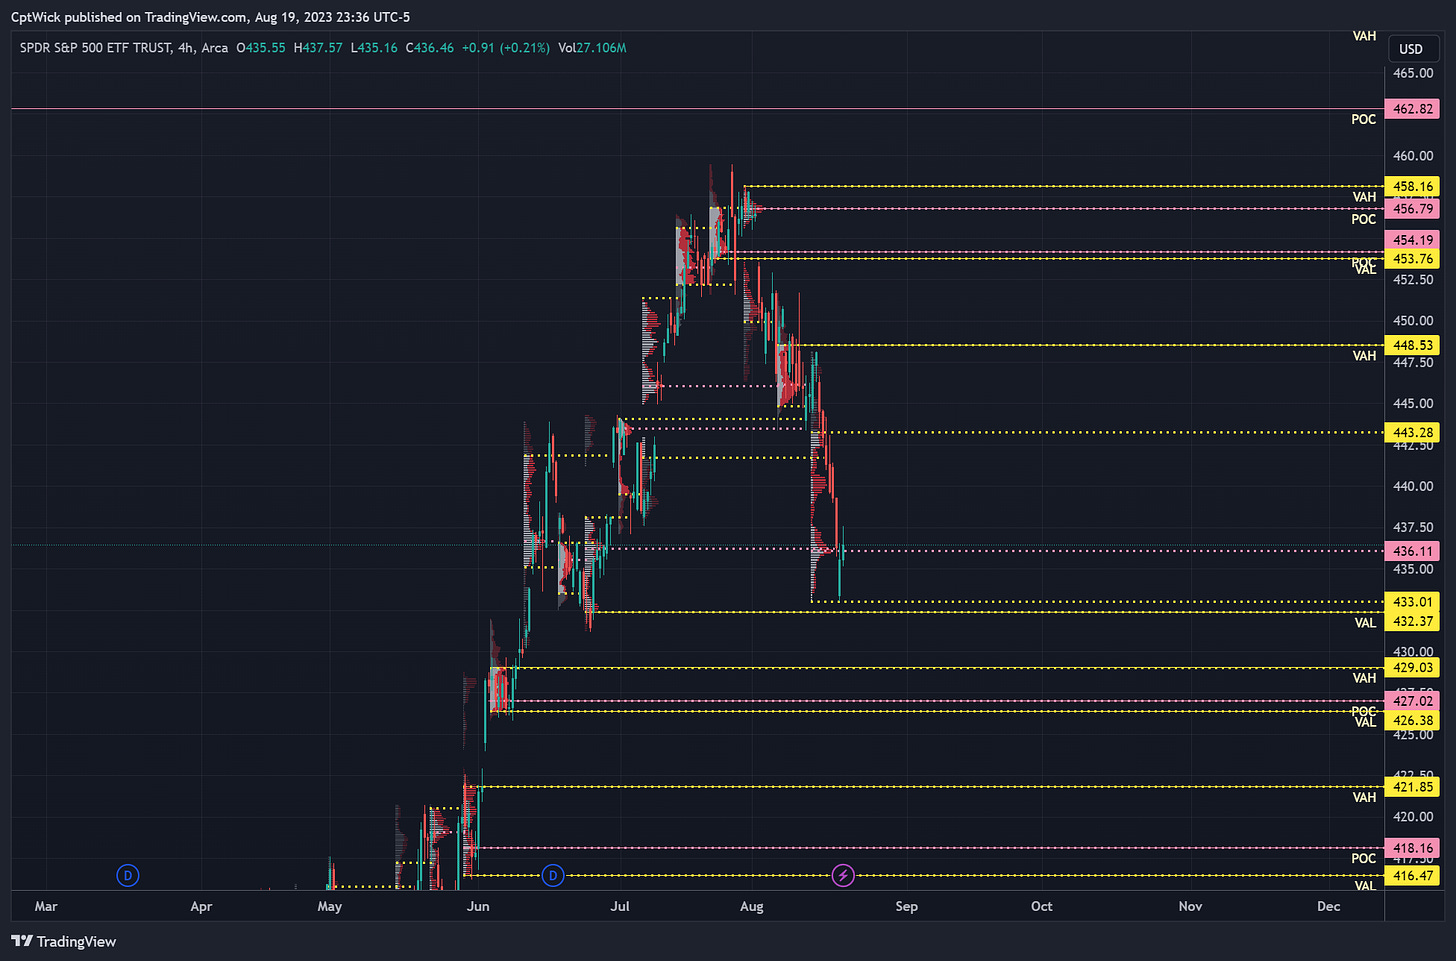
Weekly Volume Profile Levels
Last Week's Levels
443.28 VAH
436.11 POC
433.01 VAL
Notable Naked Levels
458.16 VAH
456.79 POC
454.19 POC
453.76 VAL
448.53 VAH
432.37 VAL
429.03 VAH
427.02 POC
If you are a bull, you want to see price hold 436 (POC). Above 436 we have room to test 443.23 (the VAH). If we fail at 436-432, we could be headed towards 427-424.
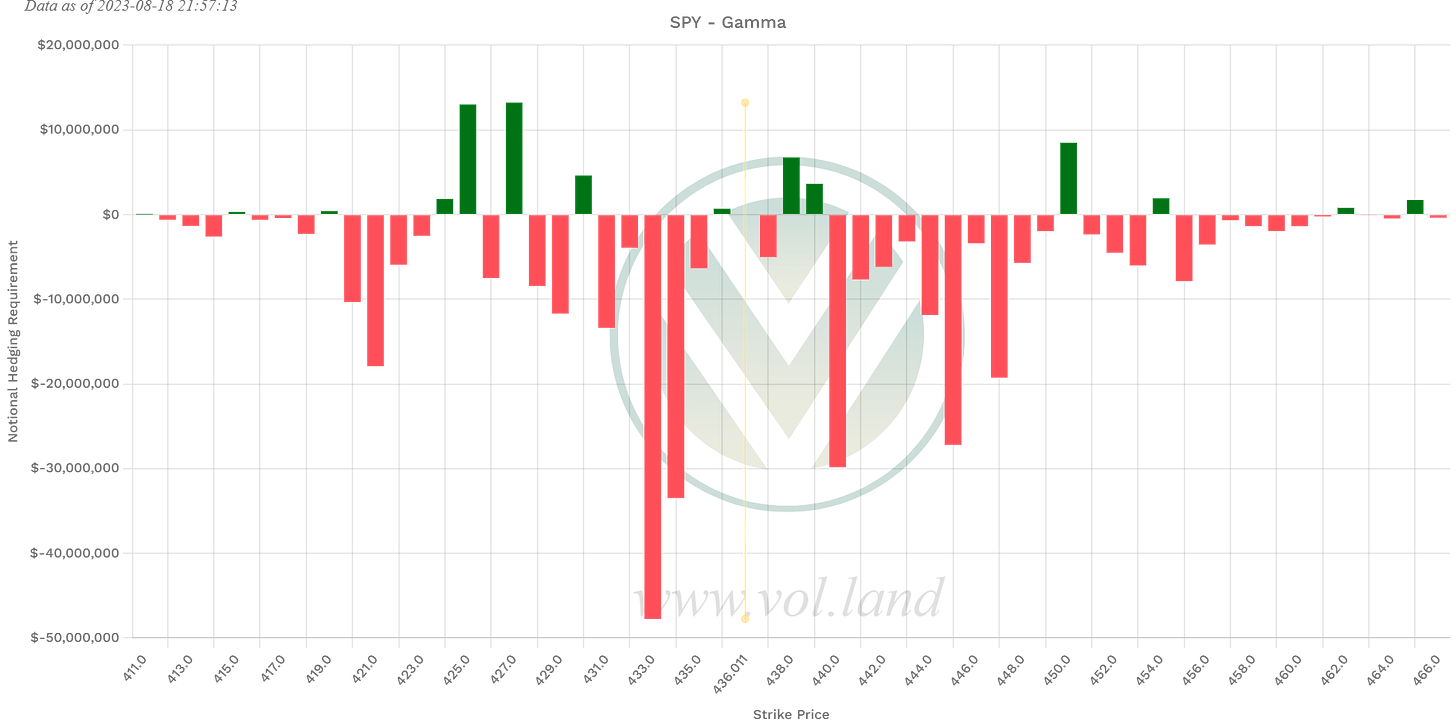
Positive Gamma
Aggregate
424, 427, 438, 439, 450, 462
This week
425, 427, 430, 436, 438, 439, 450, 454, 462
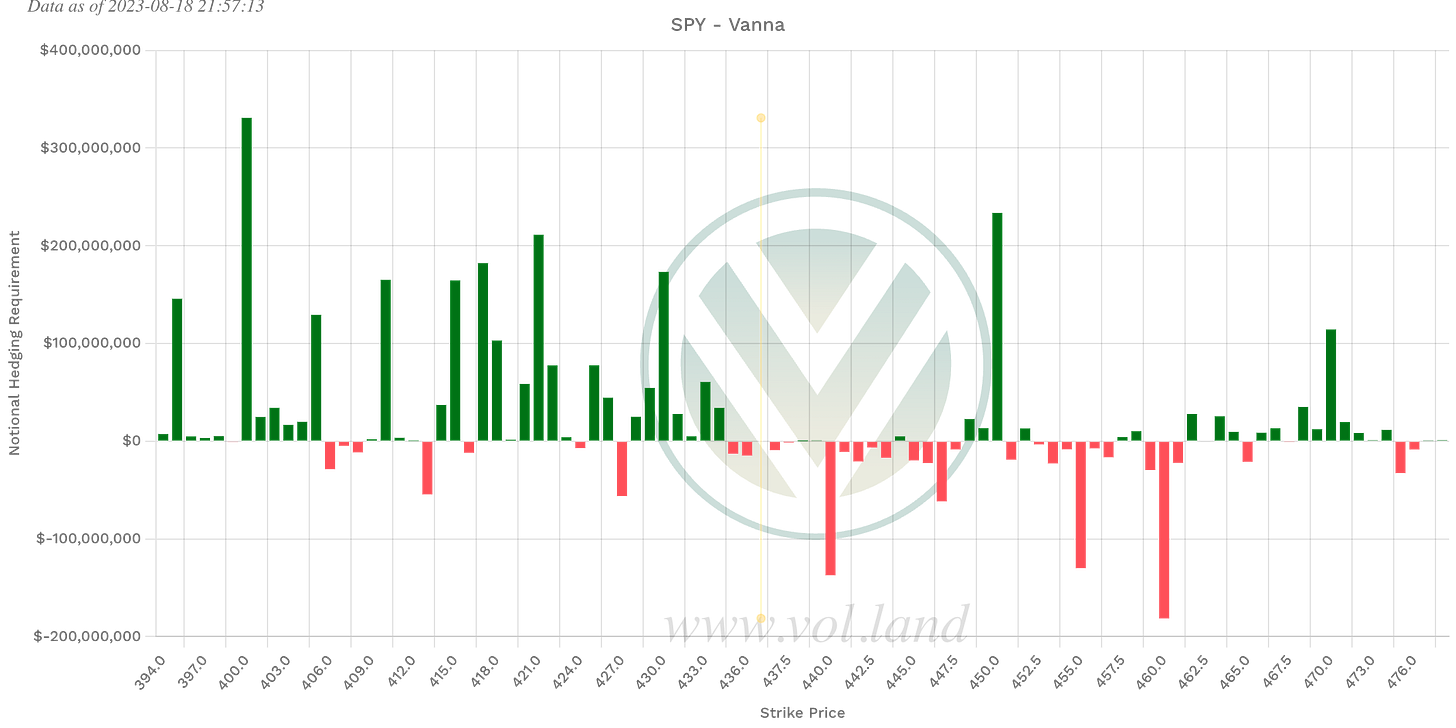
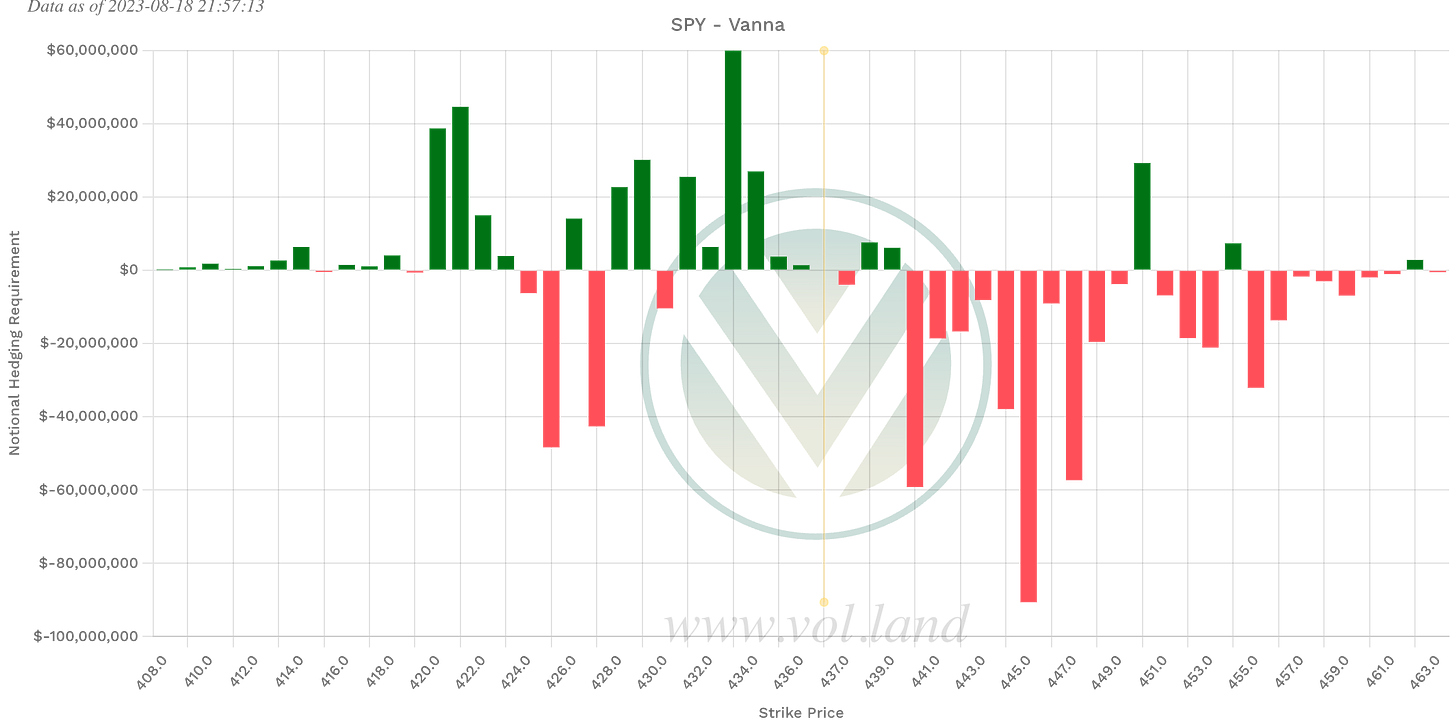
Negative Vanna
Aggregate
424, 427, 435-443, 445-447.50
This week
424, 425, 427, 430, 437, 440+
So the age old question, do we go up or down? I believe that to start the week, if you are bullish you want to see price open above 436.11. If this happens we could see 443, above that I would want 446. If we open under 436.11, the next areas of a possible bounce would be 433-432 or 429-427. We also have a open gap fill at 423.95-422.92.
Happy Trading,
—WICK—
To cover our basis…
Welcome to my Substack where I provide a daily SPY trading plan to help guide my intraday trading. The purpose of this letter is not to advise you on your trading or investment decisions. I am simply documenting my daily trading plan for myself to help with planning and execution. These are simply my opinions and the data sourced from the likes of vol.land, TradingView, Quantdata.us and others. The stock market is risky, gains are not guaranteed. This is not about getting rich quick, but learn to educate yourself and make the necessary financial decisions on your own. This is not financial advice.

